What is RADAR Analytics?
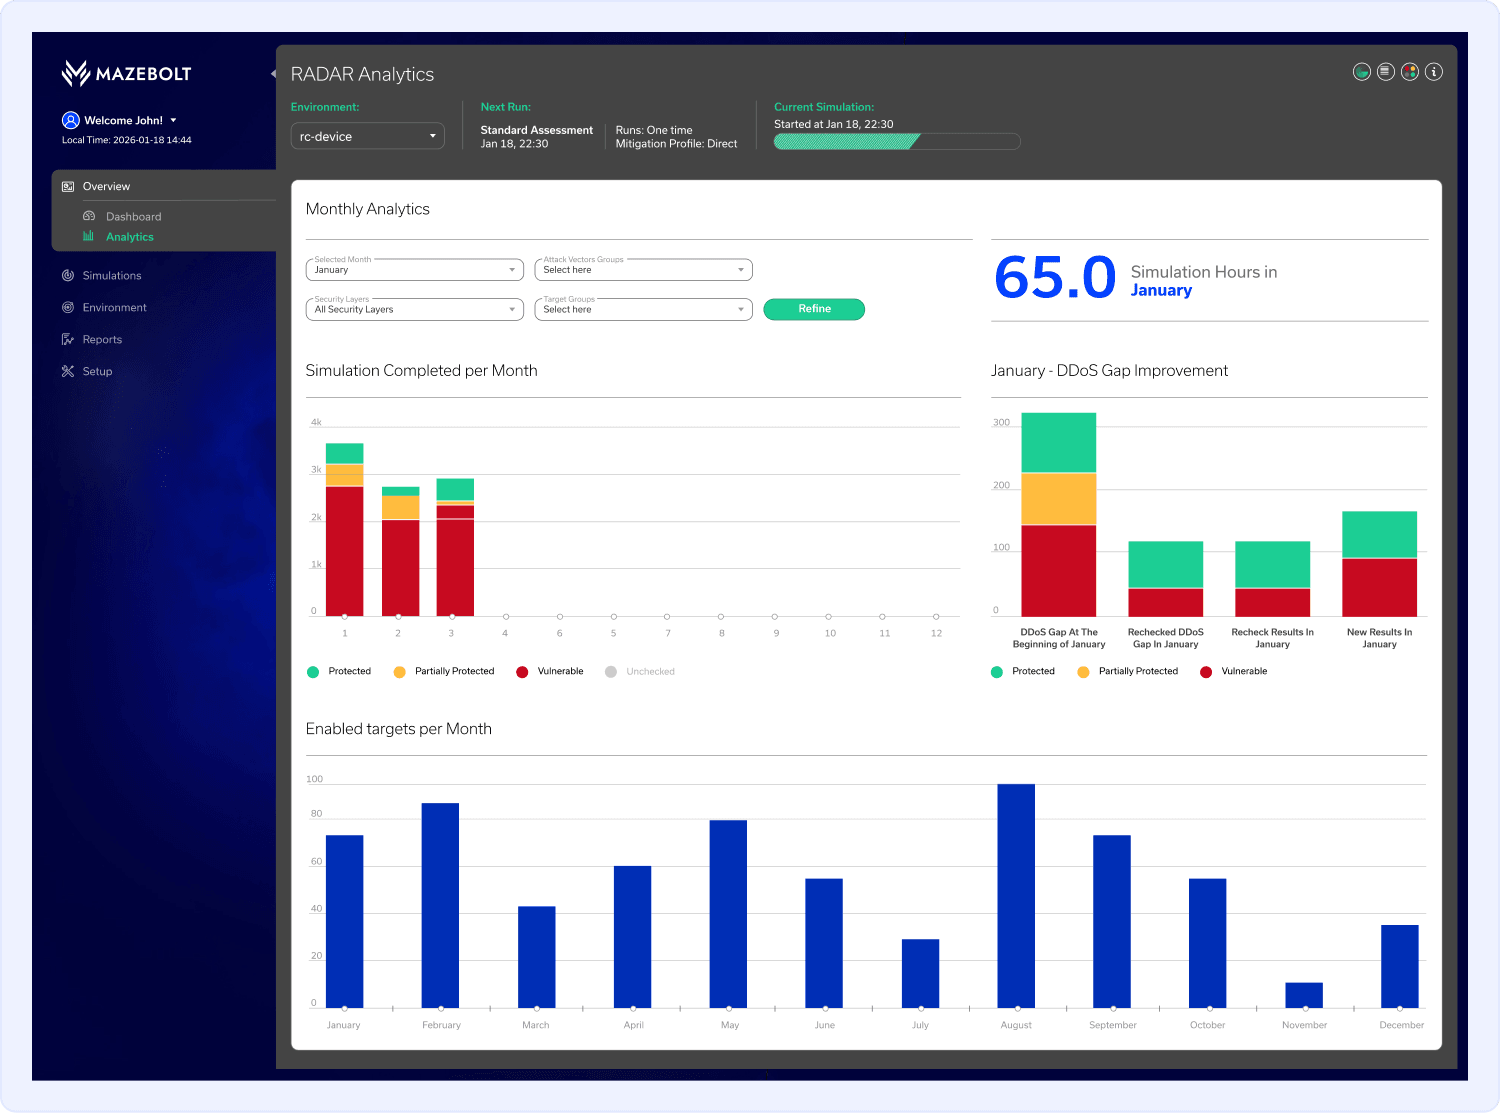
The RADAR Analytics page provides a consolidated view of your simulation activity and monthly DDoS security posture. It enables you to track the progress of simulation result statuses and drill down into specific findings. Analytics data updates automatically based on your selected filters.
What You'll Learn on This Page
On this page, you'll learn how to view your monthly simulation activity, including the total number of simulations executed and their result statuses (Protected, Partially Protected, Vulnerable, and Unchecked).
Viewing the RADAR Analytics
Follow these steps to view your RADAR analytics in the RADAR platform:
- In the left-hand navigation menu, click Overview.
- Select Analytics.
- Use the filter bars to select the data you want displayed on the graphs, then click Refine to apply your selections.
What You'll Find on the Analytics Page
The RADAR Analytics page provides a visual summary of your simulation activity and DDoS security posture for the selected month. At the top of the interface, the 4 filter menus allow you to refine the data displayed by selecting:
- Month Attack
- Vector Group
- Security Layer
- Target Group
After making your selections, click Refine to refresh the charts. The page then displays 4 charts to help you track progress.
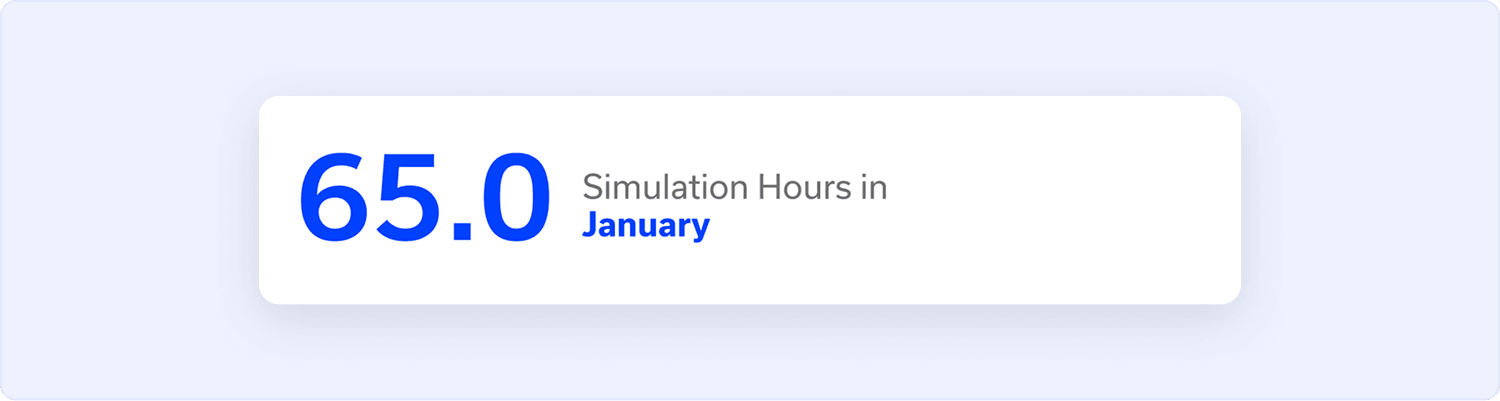
- Simulation Hours Metric
This metric displays the total number of simulation hours recorded for the selected month. Tracking simulation hours helps you measure the level of testing activity in your environment and confirm consistent coverage.
- Simulation Results per Month Chart
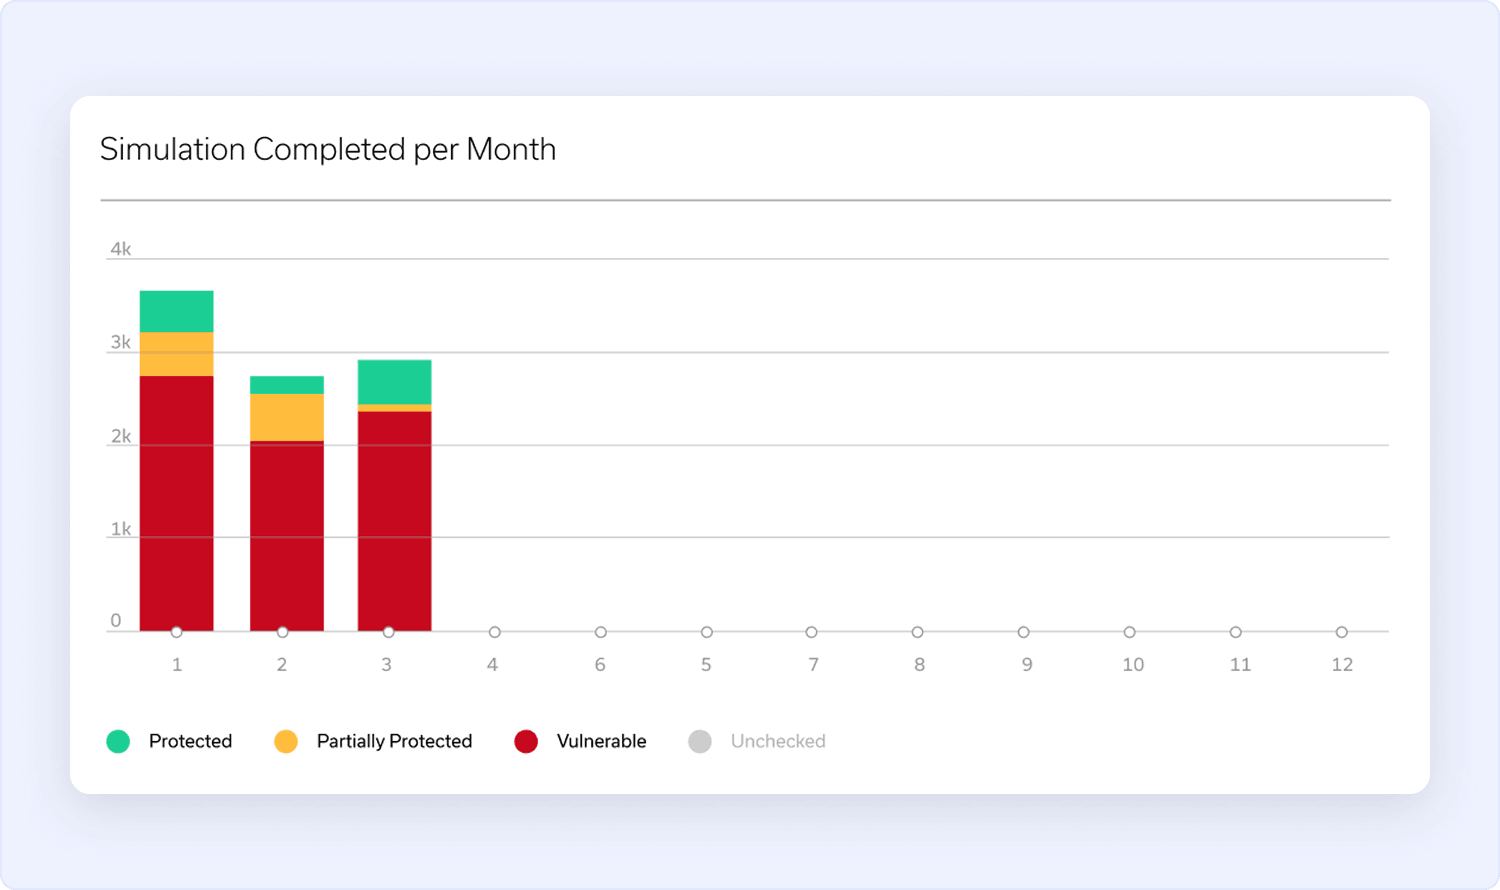
This chart shows the monthly distribution of simulation results, categorized by status: Protected, Partially Protected, Vulnerable, and Unchecked. It helps you track how your security posture evolves over time, identify periods with higher vulnerability exposure, and measure improvements in protection coverage across months.- The X-axis represents months.
- The Y-axis represents the number of simulation results recorded.
Note
1. Clicking a legend item opens the Simulation Results page with the table automatically filtered by the selected status (e.g., selecting the red legend displays only Vulnerable results).
2. The month selected from the filter dropdown is displayed as the final month on the chart. The chart then shows the 12 preceding months leading up to the selected month.
3. Below the chart, each status is listed with its corresponding color. Click a status to show or hide it in the chart view.
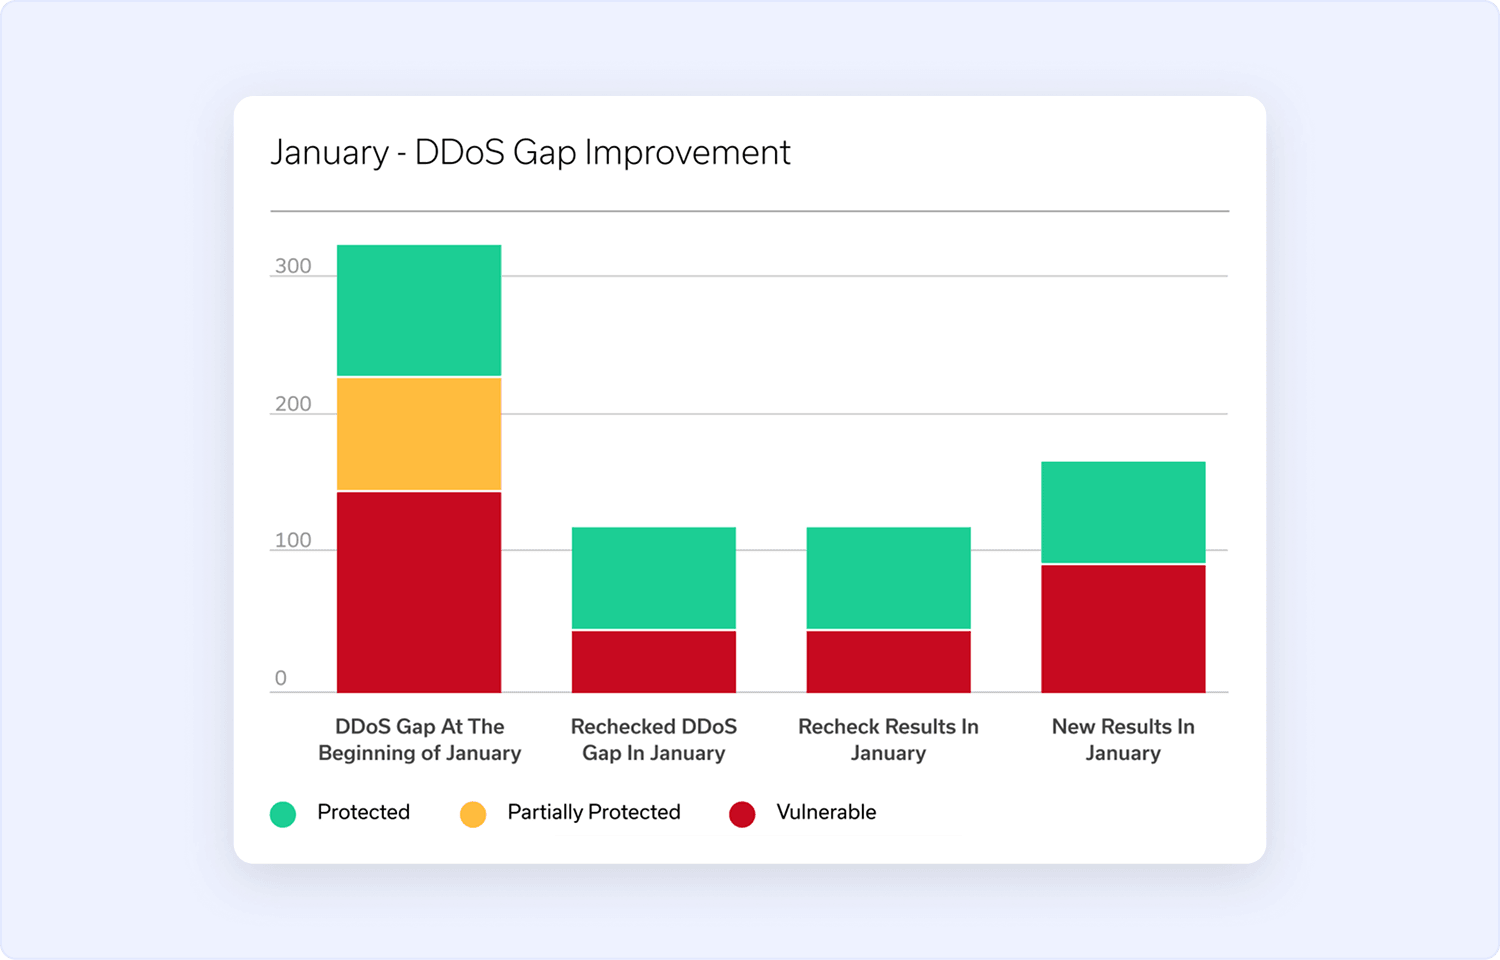
- DDoS Gap Improvement Chart
This chart shows how your DDoS protection posture has changed over the selected month. It highlights the size of the DDoS gap at the beginning of the month and compares it with rechecked and newly identified results. All 4 bars are broken down by status (Protected, Partially Protected, and Vulnerable).- DDoS Gap at the Beginning of the Month bar - Displays the number of simulation results recorded at the begging of the month.
- Rechecked DDoS Gap bar - Displays the results that were retested during the selected month to confirm whether protections changed.
- Rechecked Results bar - Displays the outcomes of previously tested results that were simulated again during the selected month.
- New Results bar - Displays new results status during the selected month.
This visualization helps you track whether the gap is increasing / decreasing over time and evaluate the effectiveness of your remediation efforts.
Note
1. Clicking any result color section opens the Simulation Results page with the table automatically filtered by the selected status (e.g., selecting the red section displays only Vulnerable results).
2. Below the chart, each status is listed with its corresponding color. Click a status to show or hide it in the chart view.
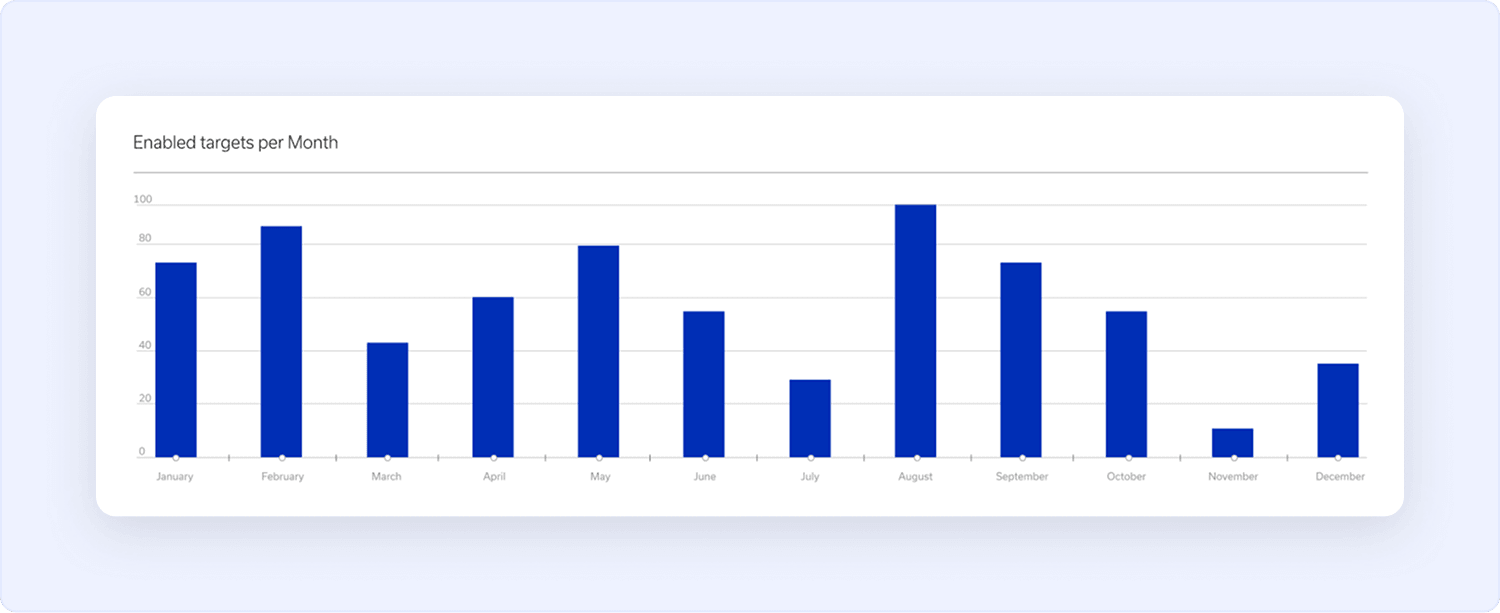
- Enabled Targets per Month Chart
This chart displays the number of Targets that were enabled in your environment during each month. Each bar represents the total count of active Targets for that specific month. Tracking enabled Targets over time helps you monitor validation scope growth and confirm critical assets are consistently simulated.