
What is a Security Layer?
A Security Layer refers to any network-based or cloud-based component that inspects, filters, or mitigates traffic as part of your overall DDoS protection strategy. This may include:
- Scrubbing Centers (SCBs)
- Web Application Firewalls (WAFs)
- Customer Premise Equipments (CPEs)
- Content Distribution Networks (CDNs)
Each Security Layer plays a role in analyzing and blocking malicious traffic before it reaches your protected assets.
What You'll Learn On This Page
In this section, you’ll learn how to assign each network interface to its corresponding Security Layer.
This assignment allows the platform to associate the deployed mirror port with the correct security layer, enabling accurate visibility into how traffic flows through your existing mitigation infrastructure.
For Azure deployments, you will also learn how to configure interfaces for log-based traffic ingestion through Azure Event Hub, enabling RADAR to collect the data required for simulation validation without relying solely on traffic mirroring.
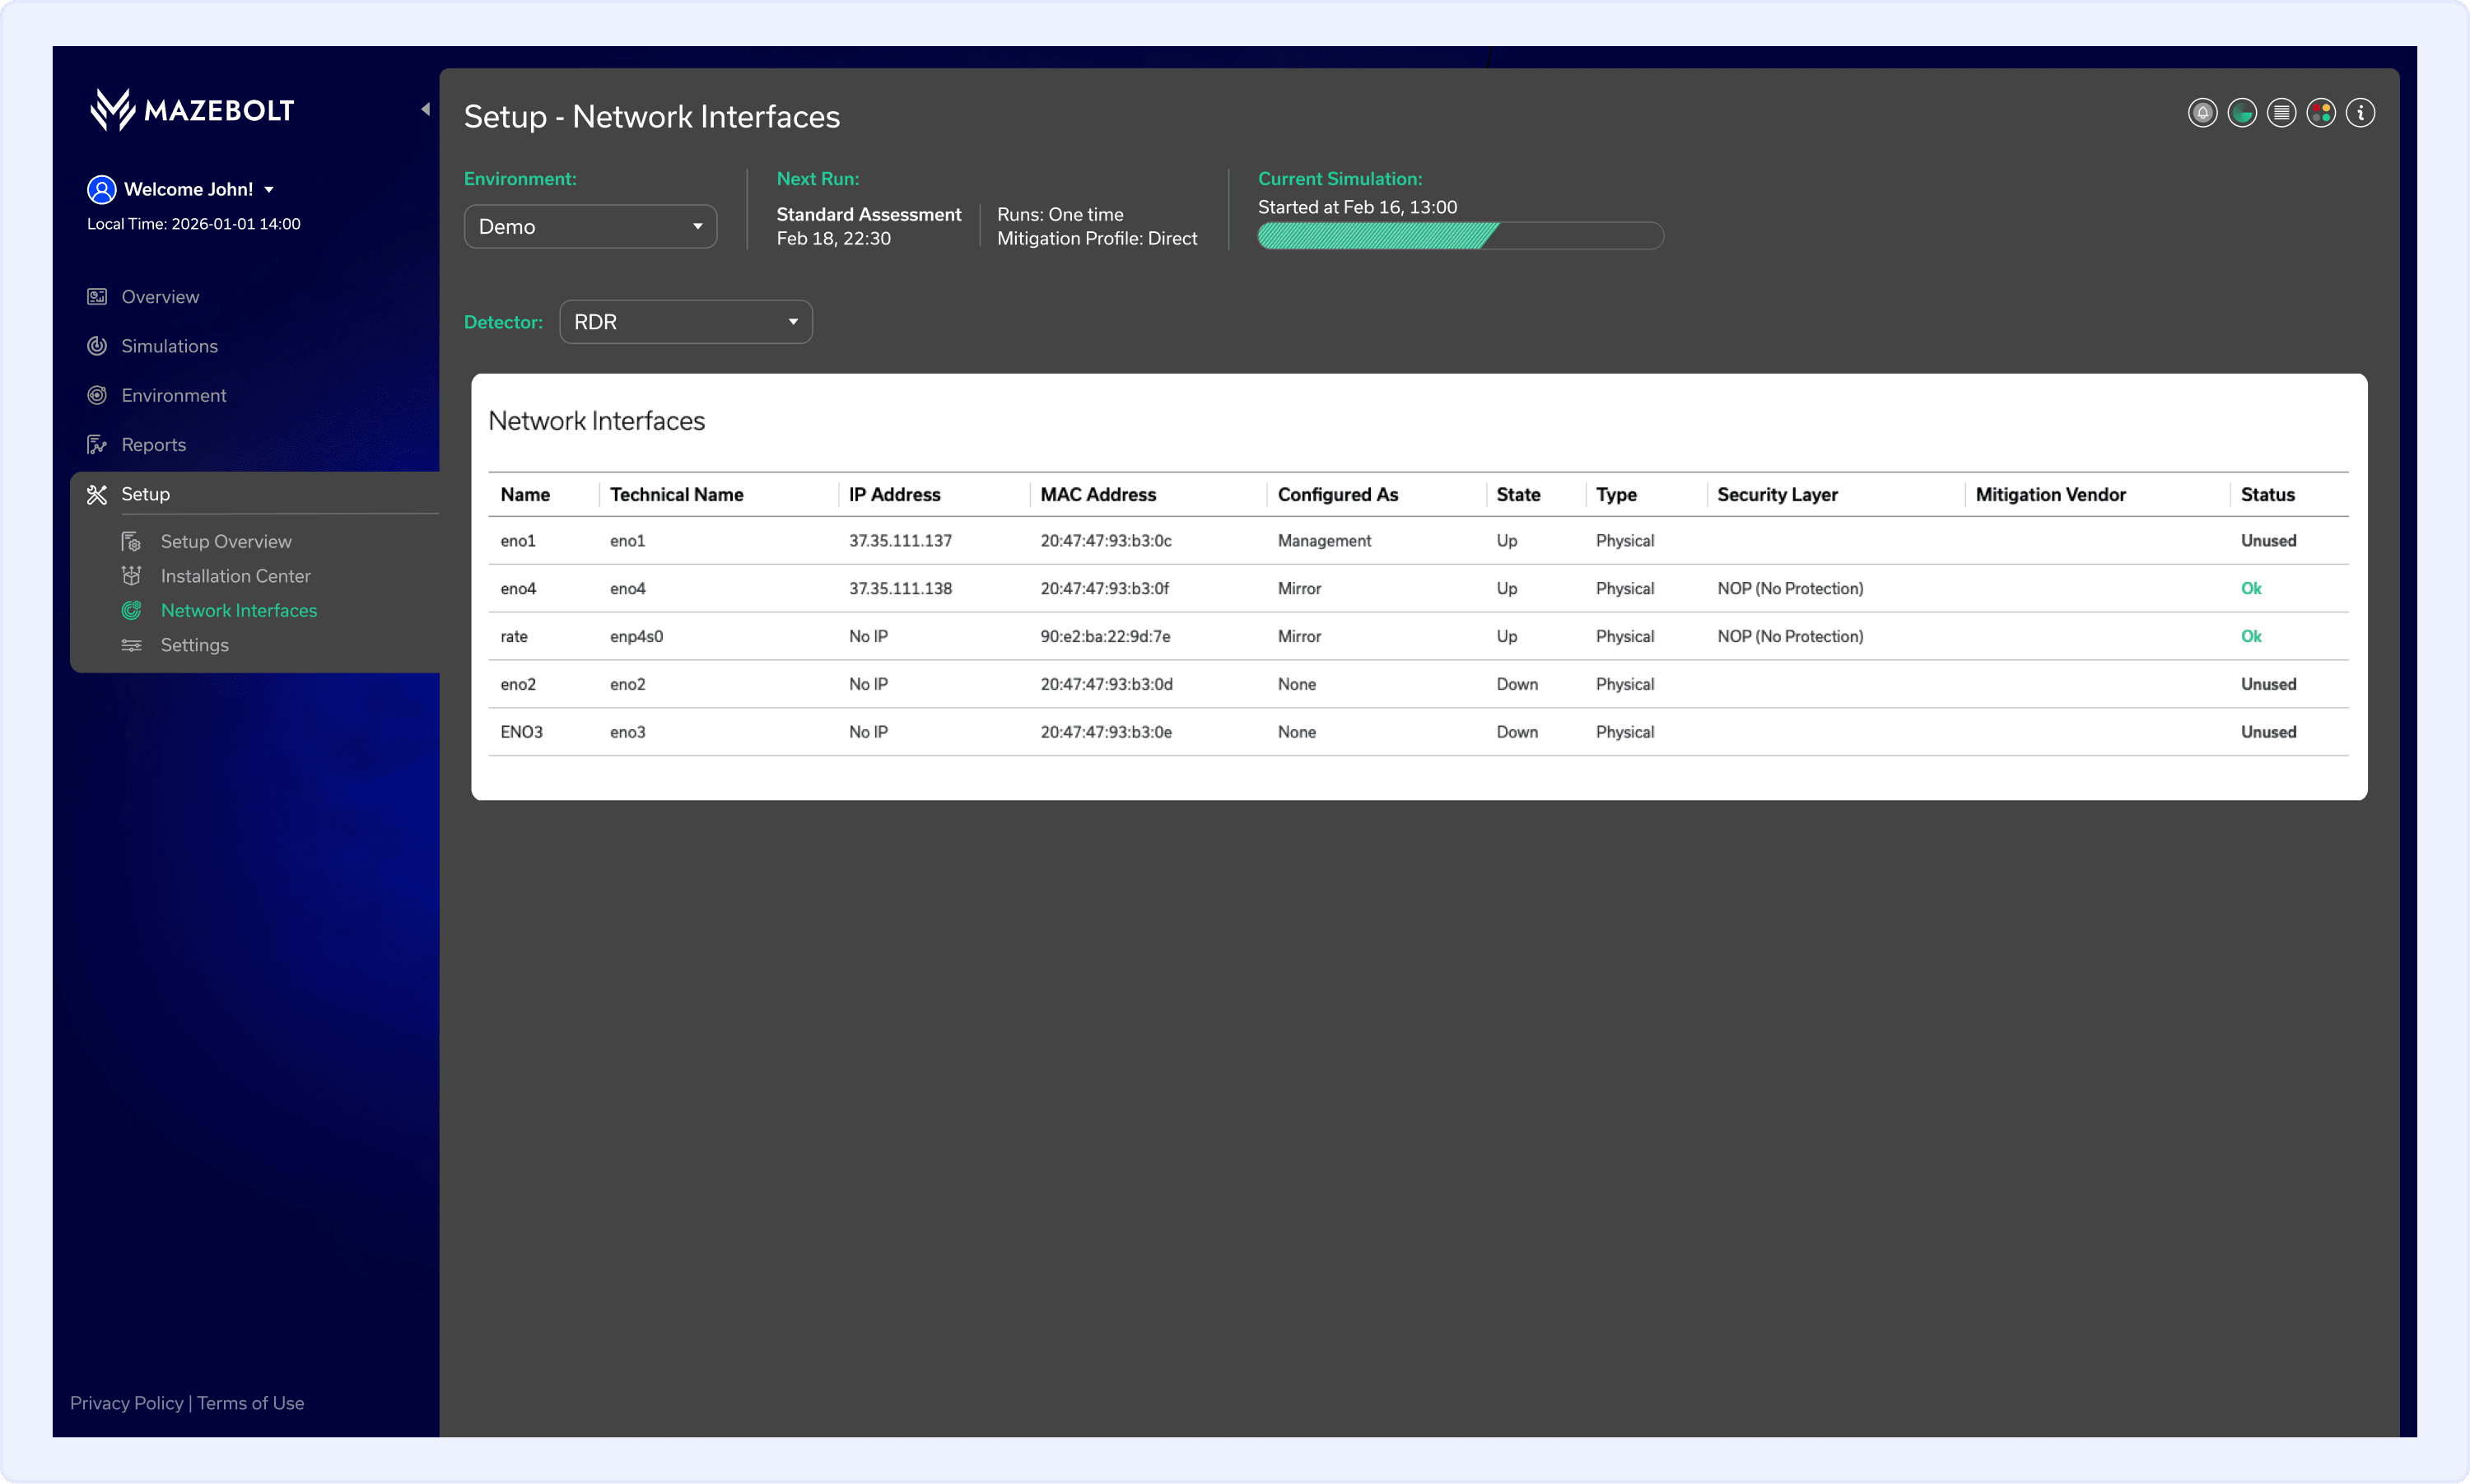
Assigning a Network Interface to a Security Layer
Follow these steps to add a Network Interface in the RADAR platform:
- In the left-hand menu, click Setup.
- Navigate to the Network Interfaces page.
- Click the name of the interface you want to assign.
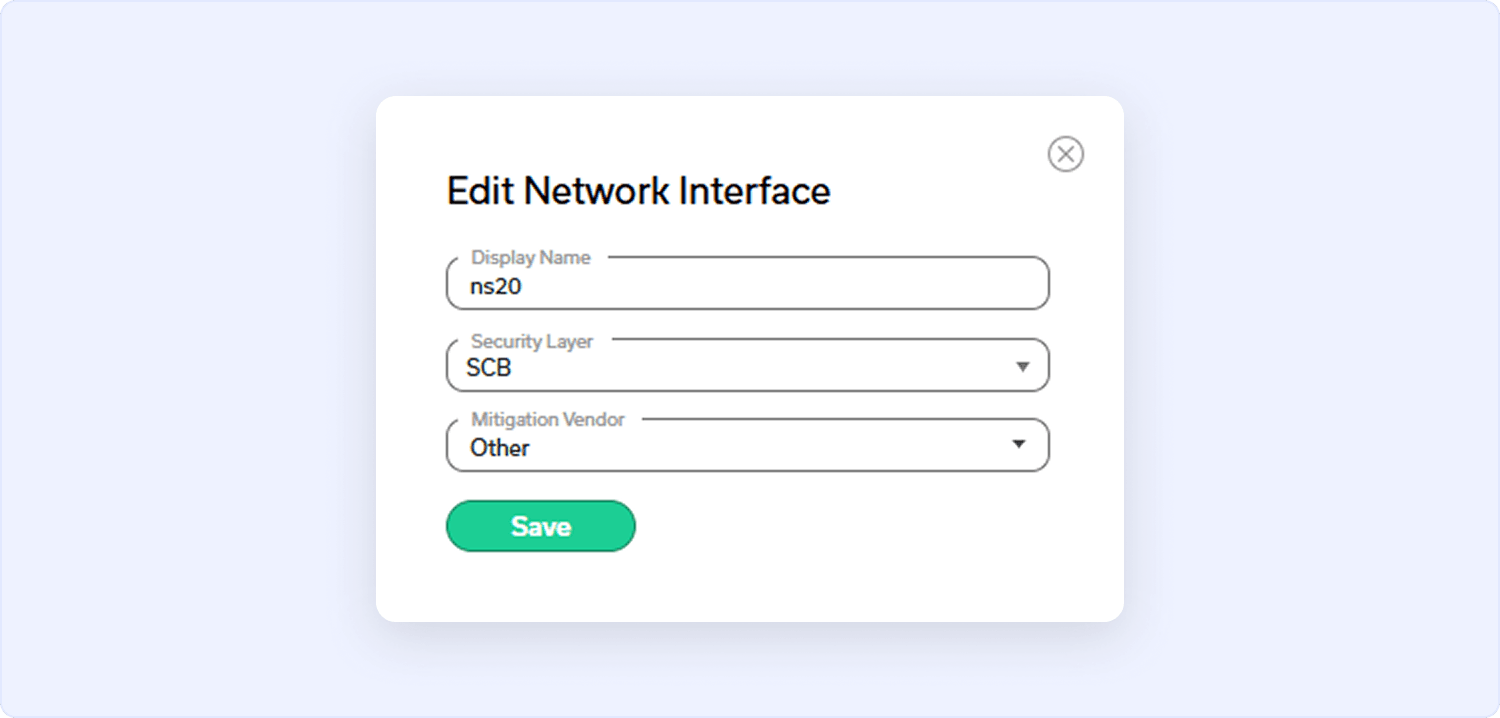
For Direct Traffic (Mirroring)
When Direct is selected under the Traffic Source dropdown:
- Select the appropriate Security Layer for the interface.
- Click Save to apply the changes.
Note
If a required Security Layer is missing from the list, please contact your Technical Account Manager or Professional Services Manager for support.
For Azure Log-Based Traffic
Overview:
Log-based ingestion from Azure requires a dedicated virtual network interface on the RADAR Detector. This interface is configured to receive the filtered traffic logs delivered via Azure Event Hub.
Before assigning the interface, the following must be completed on the Azure side:
- An Azure Event Hub has been created to receive the traffic logs
- The relevant Azure service (for example, Front Door or Application Gateway) has been configured to stream logs to that Event Hub
- The Event Hub's Connection String and Event Hub Name have been collected
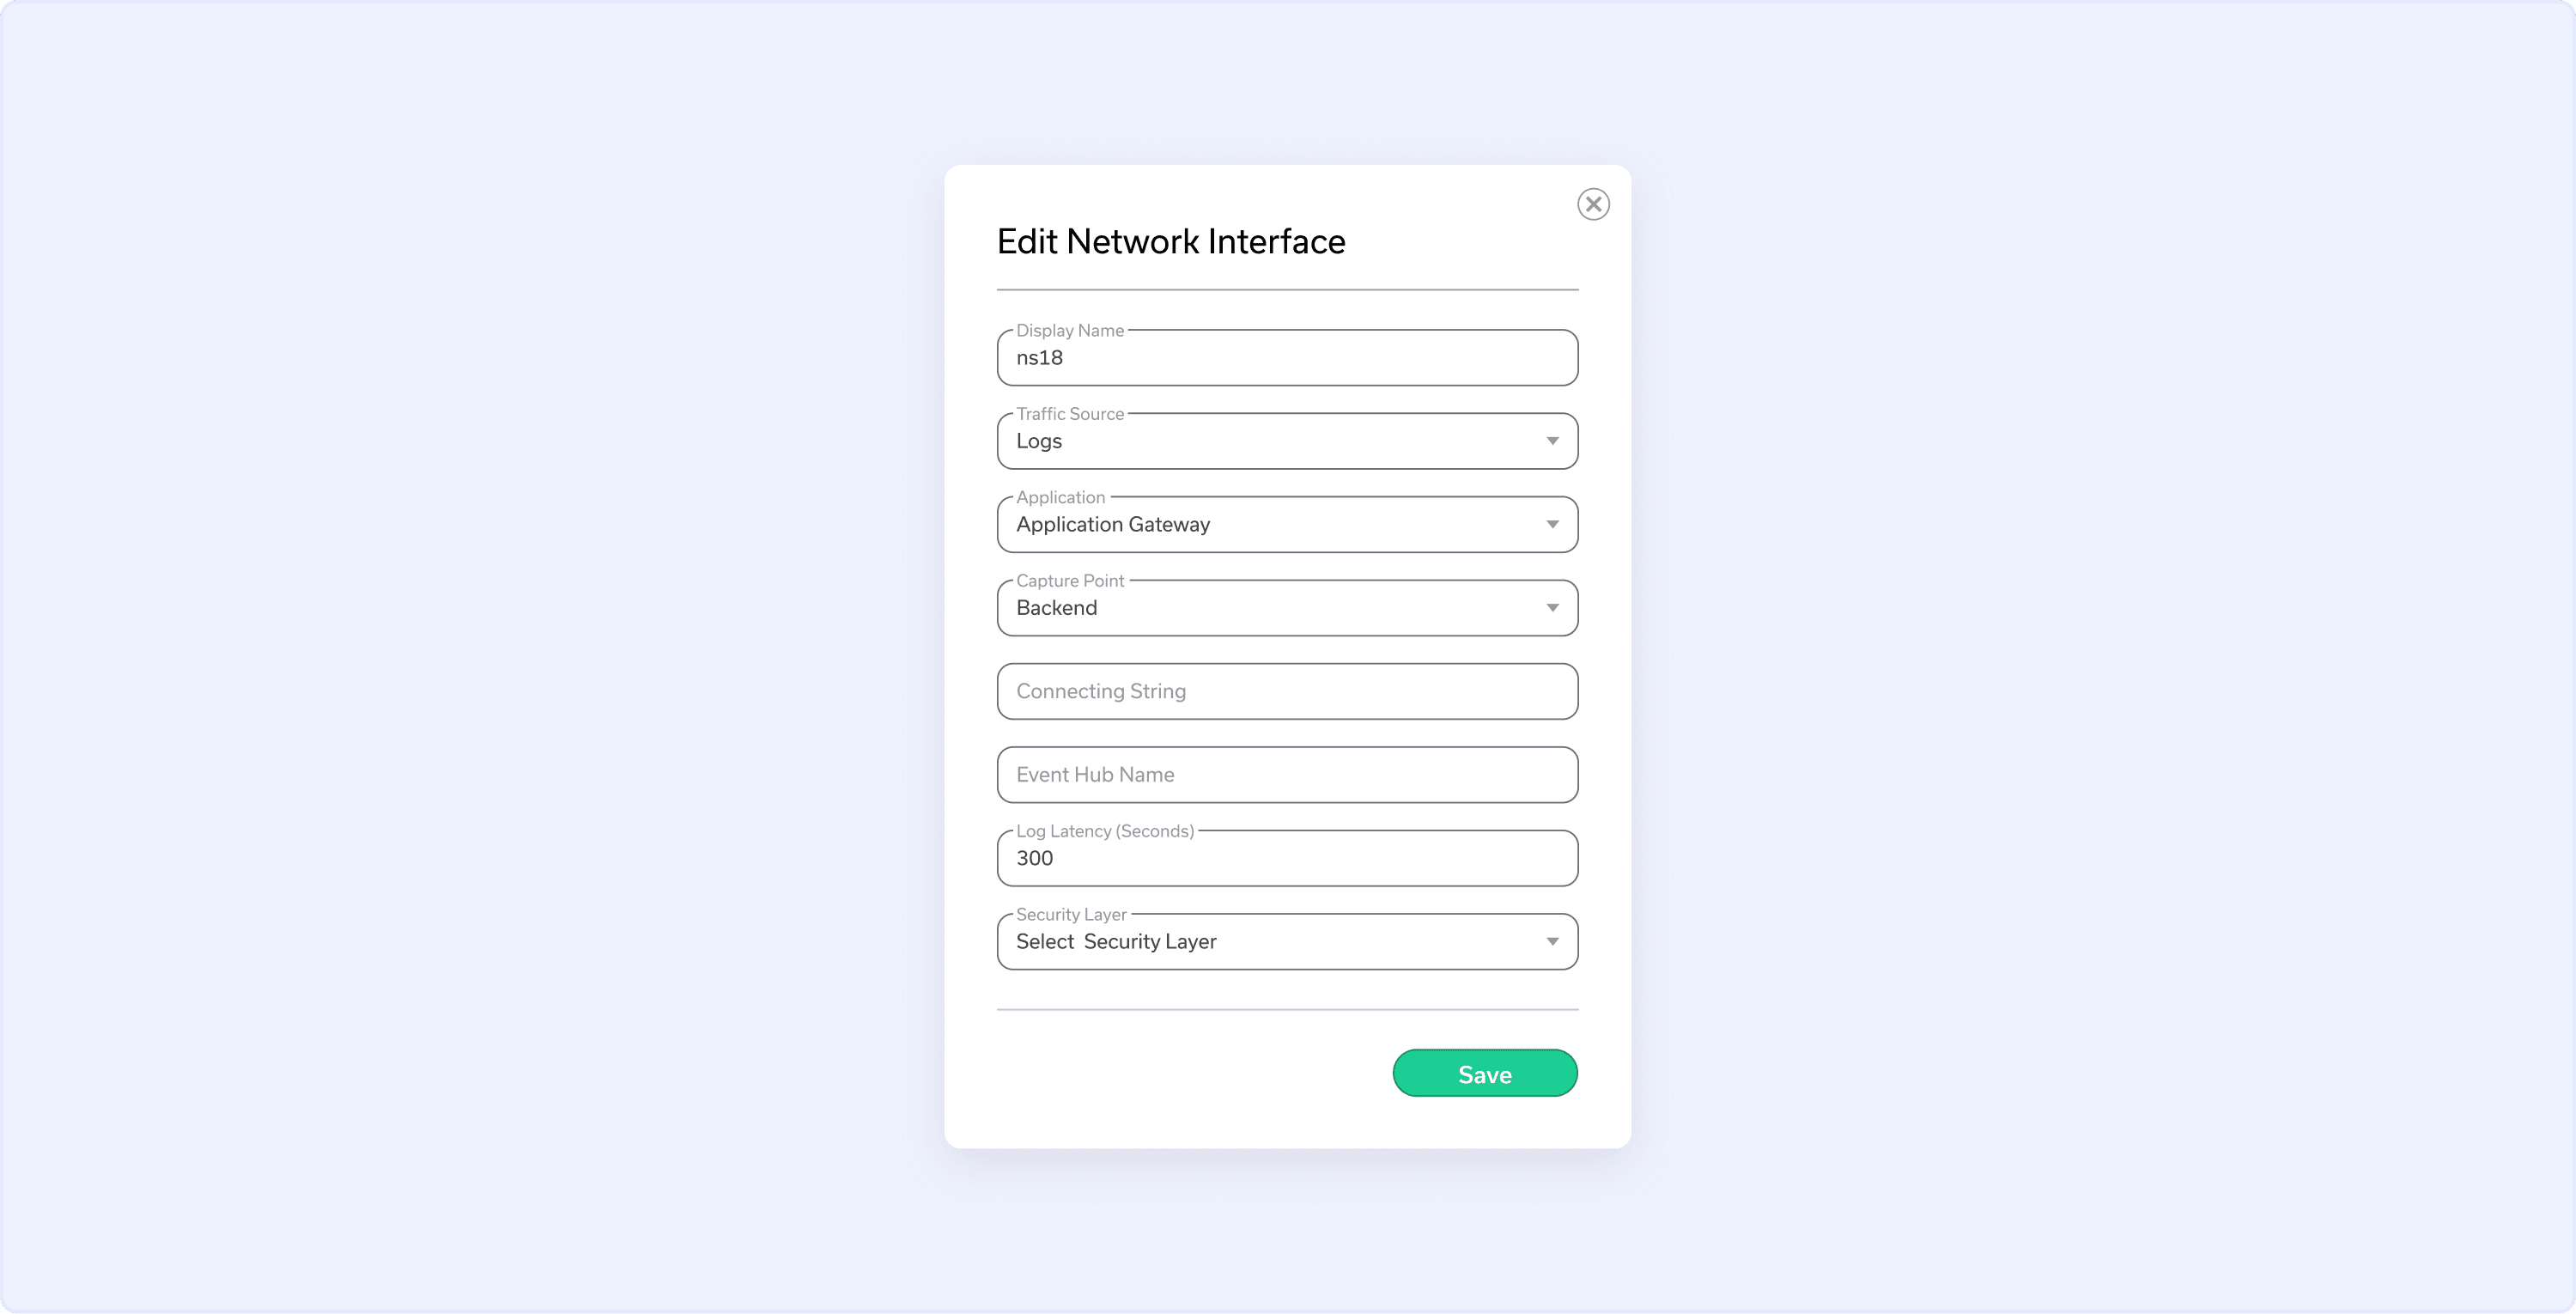
Configure the Azure Interface:
When Logs is selected under the Traffic Source dropdown:
- Select the relevant Application (for example, Front Door or Application Gateway).
- Select the relevant Caprute Point (Frontend or Backend).
- Enter the Connection String of the configured Azure Event Hub.
- Enter the Event Hub Name.
- Configure the Log Latency (Seconds) based on your environment.
Log latency is the elapsed time between when a packet arrives at the Azure networking layer and when its corresponding log record becomes available in Event Hub for RADAR to read. This delay is introduced by Azure's internal log processing pipeline - logs must be generated, enriched, buffered, and flushed to Event Hub before they can be consumed. - Select the appropriate Security Layer for the interface.
- Click Save to apply the changes.
Note
In order to retrieve the Connection String:
- In the Event Hub namespace, navigate to Settings > Shared Access Policies.
- Create a dedicated Shared Access Policy with the Listen claim only. To do this, click + Add, provide a name (e.g., radar-listener), check Listen, and click Save.
Do not use RootManageSharedAccessKey for this purpose, it grants Manage and Send permissions that RADAR does not require. - Copy the Connection string–primary key. You will enter this value in the RADAR Web App platform during interface configuration.
For Cloudflare Log-Based Traffic
Overview:
Log-based ingestion from Cloudflare enables RADAR to validate DDoS mitigation coverage for targets protected by Cloudflare's CDN.
A Cloudflare Logpush job filters and delivers logs of unmitigated traffic to an R2 bucket owned by the customer, and RADAR reads that filtered log stream through a dedicated virtual network interface on the Detector, using a read-only, single-bucket key.
Before assigning the interface, the following must be completed on the Cloudflare side:
- An R2 bucket has been created to store the filtered log objects
- A Cloudflare Logpush job has been configured to deliver unmitigated traffic to that bucket
- A read-only R2 Access Key ID and Secret Access Key have been generated and shared with RADAR
- The Cloudflare Account ID and R2 bucket name have been collected
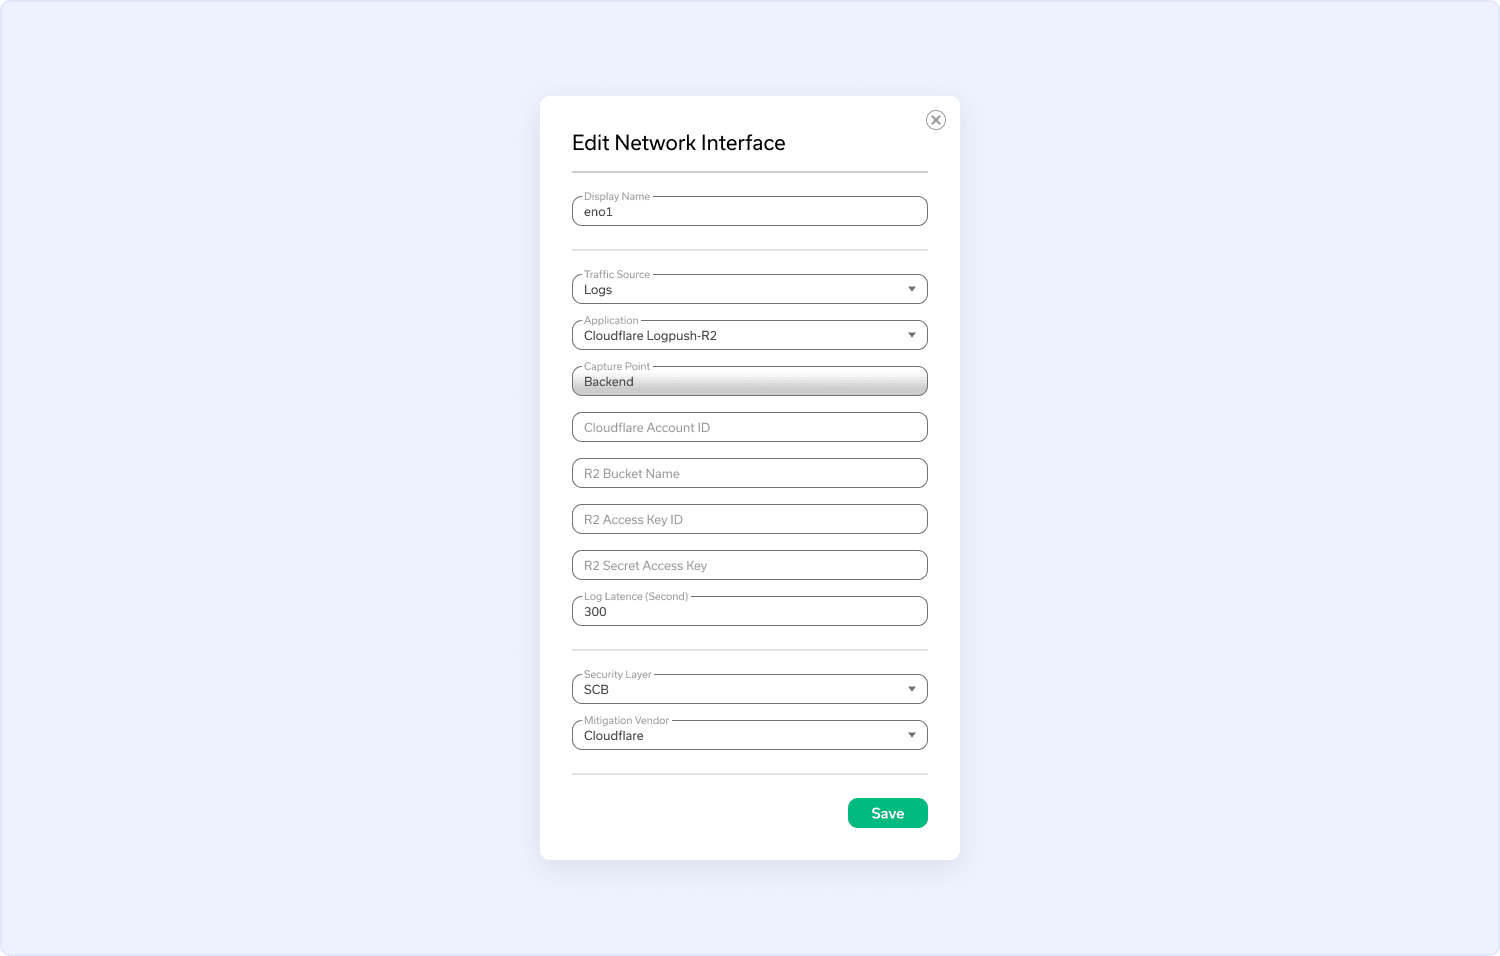
Configure the Cloudflare Interface:
- On the Network Interfaces page, click the name of the network interface to configure.
- Under the Traffic Sournce dropdown, select Logs.
- Under the Application dropdown, select Cloudflare Logpush-R2.
- Under the Capture Point dropdown, Backend is selected by default.
- Enter the Cloudflare Account ID.
- Enter the R2 Bucket name.
- Enter the R2 Access Key ID.
- Enter the R2 Secret Access Key.
- Configure the Log Latency (Seconds) based on your environment.
- Select the appropriate Security Layer for the interface.
- Select the Mitigation Vendor.
- Click Save to apply the changes.
For GCP Log-Based Traffic
Overview
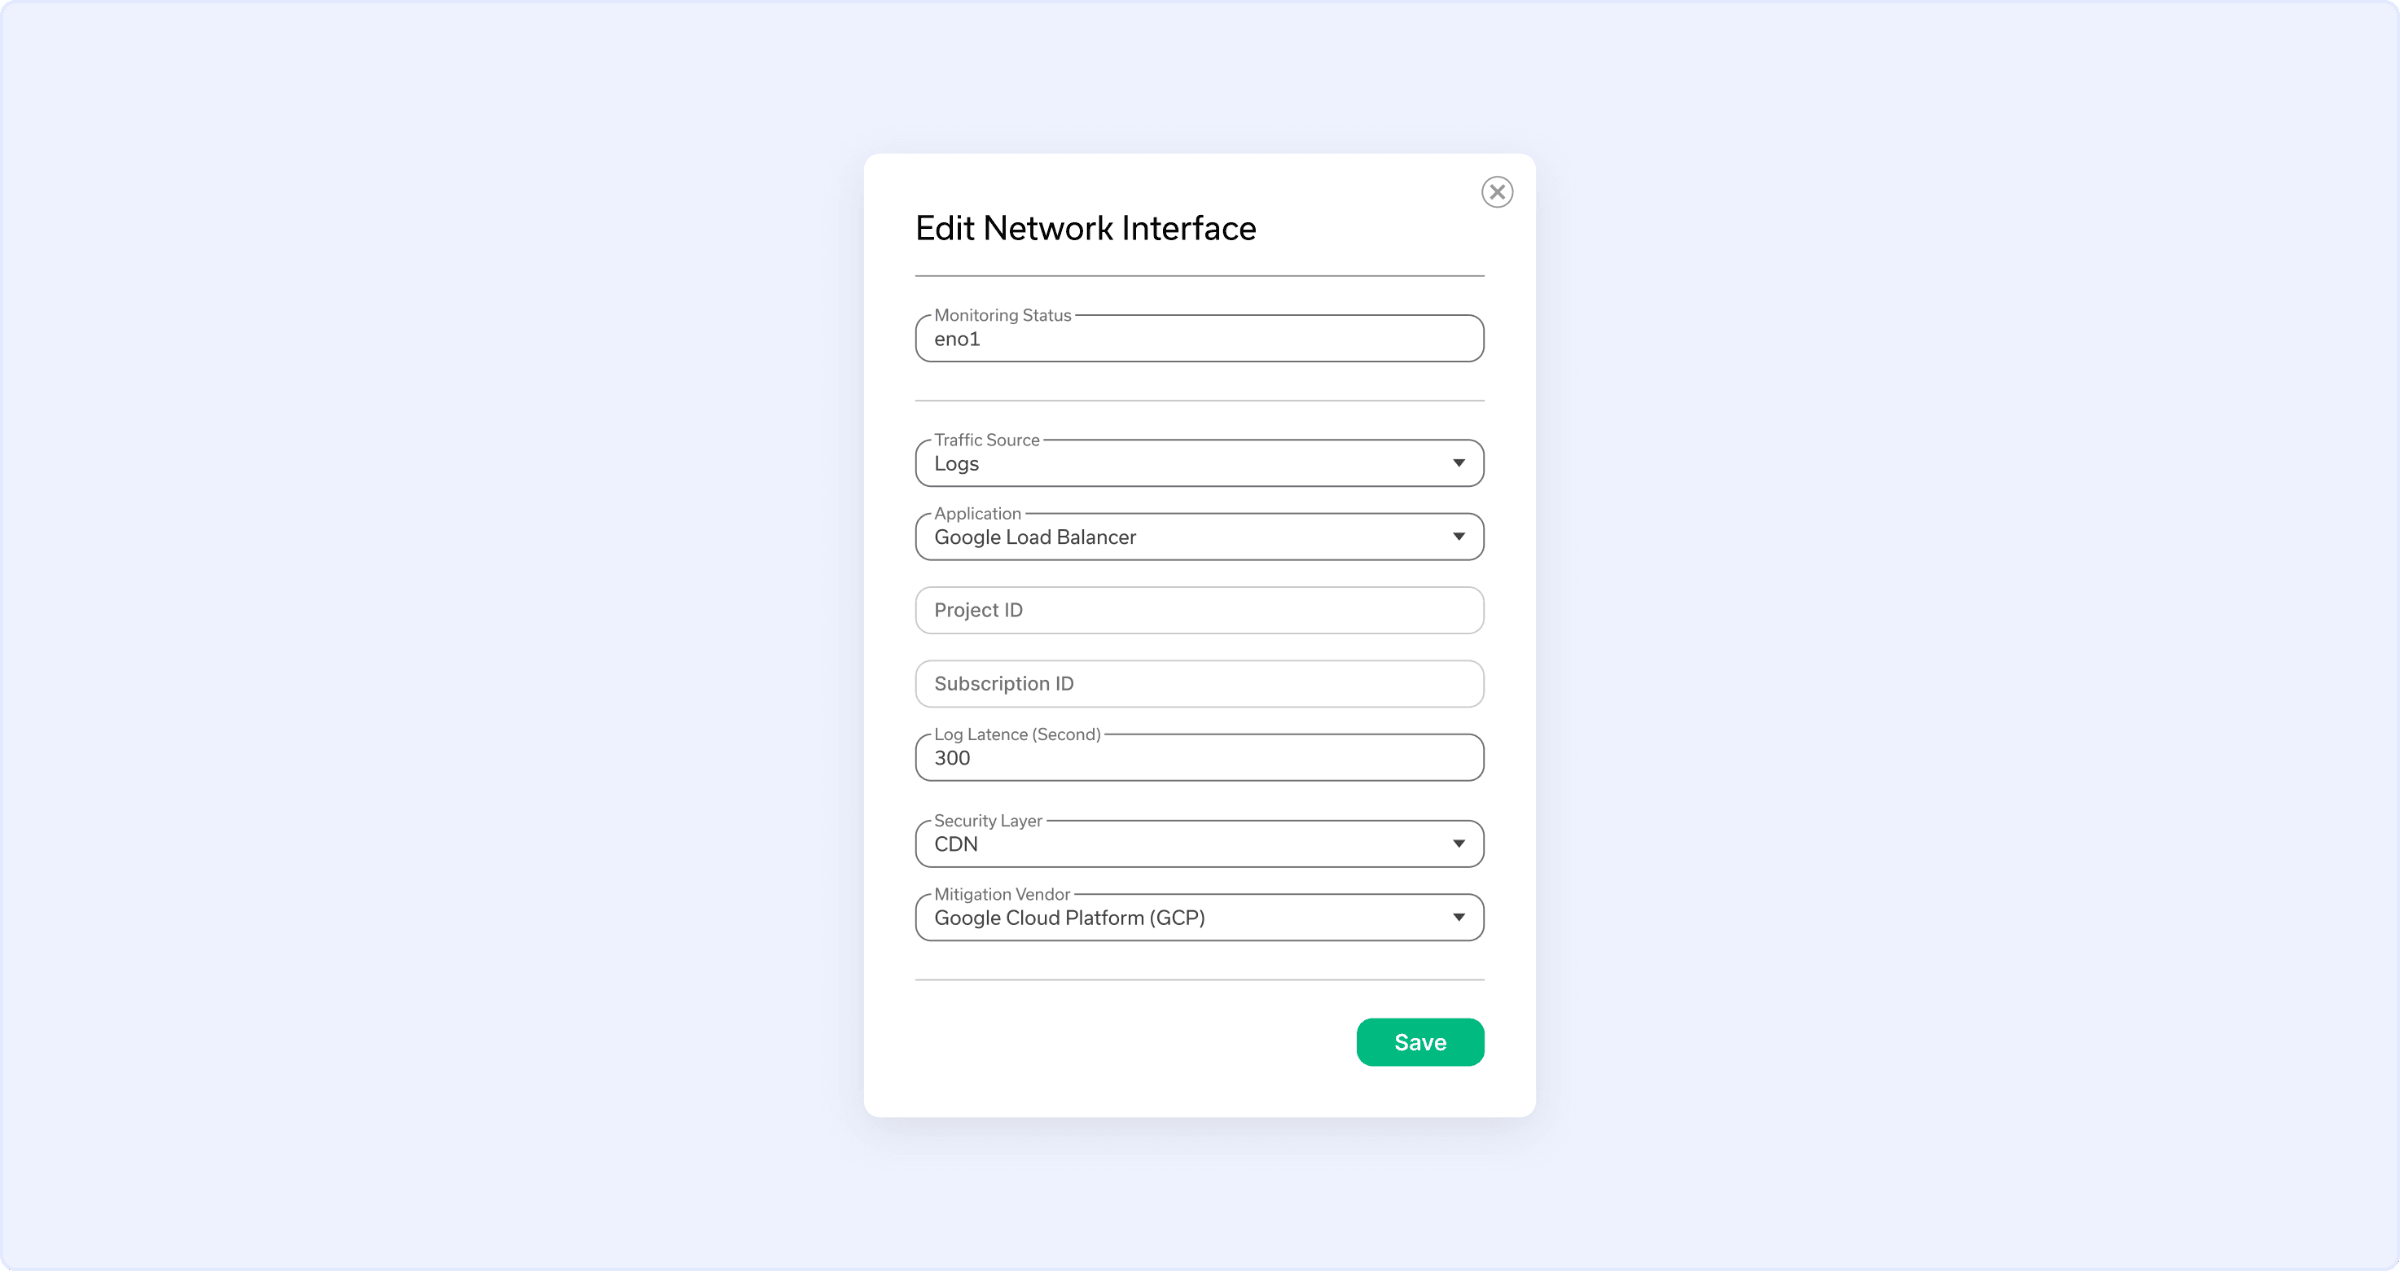
Log-based ingestion from Google Cloud enables RADAR to validate DDoS mitigation coverage for targets protected by Google’s Application Load Balancer and Apigee.
Google Cloud writes the HTTP/S request logs to Cloud Logging, and a log sink routes the relevant entries to a Google Pub/Sub topic in the customer’s Google Cloud application. RADAR reads those logs through a dedicated virtual network interface on the Detector, using read-only access to the Pub/Sub subscription.
Configure the GCP Interface:
- On the Network Interfaces page, click the name of the network interface to configure.
- Under the Traffic Source dropdown, select Logs.
- Under the Application dropdown, select Google Load Balancer or Google Apigee, matching the security layer the interface represents.
- In the Project ID field, enter the ID of the Google Cloud application that contains the Pub/Sub subscription.
- In the Subscription ID field, enter the Pub/Sub subscription ID for the measurement point the interface represents.
- Configure the Log Latency (Seconds) based on the environment.
- Select the appropriate Security Layer for the interface.
- Select the Mitigation Vendor.
- Click Save to apply the changes.
For Akamai Log-Based Traffic
Overview
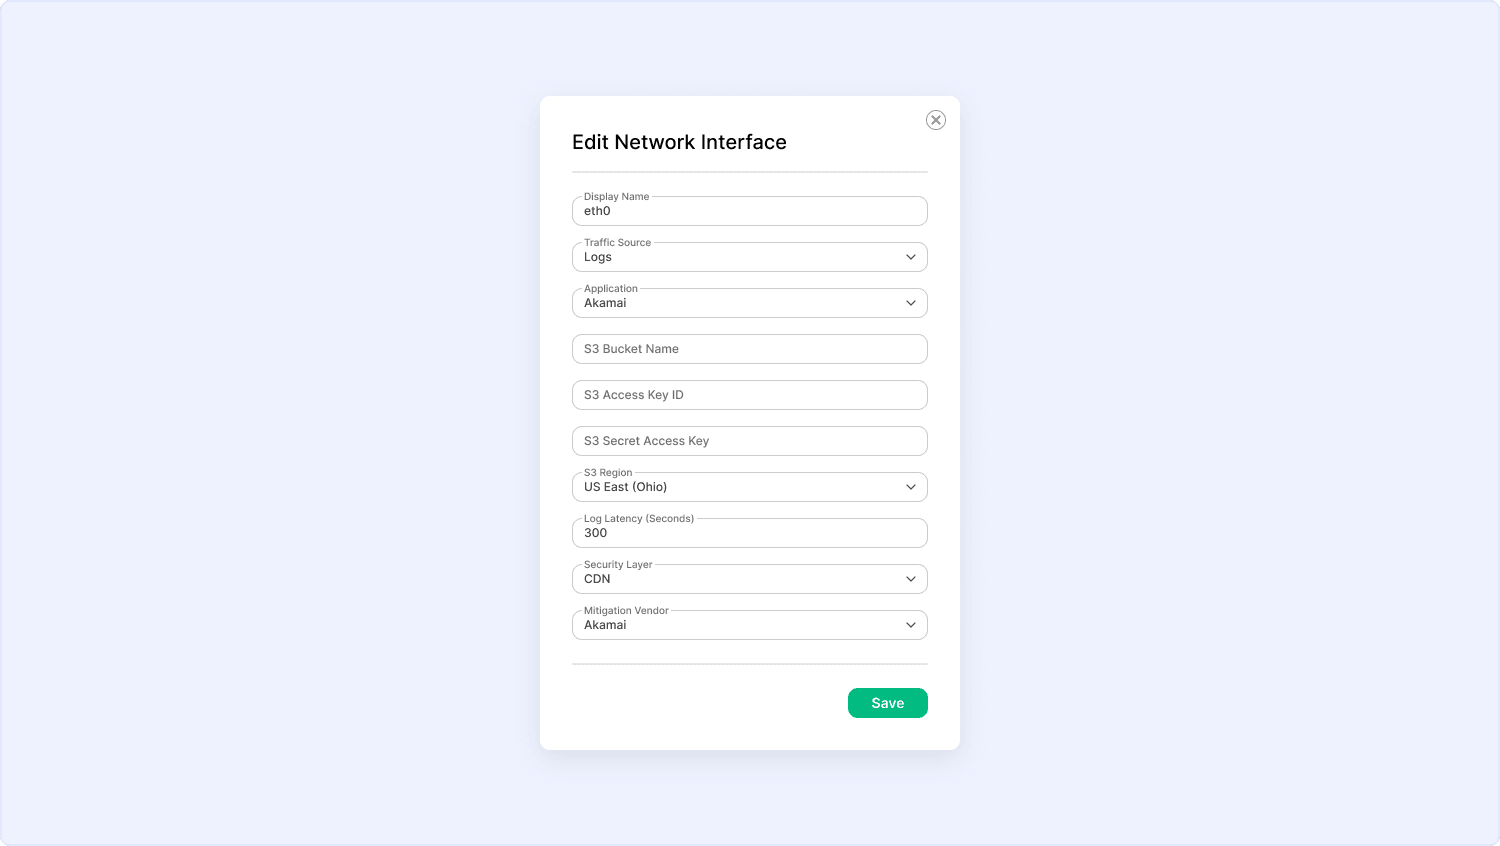
Log-based ingestion from Akamai enables RADAR to validate DDoS mitigation coverage for targets protected by Akamai.
Akamai DataStream 2, Akamai’s log delivery mechanism, filters HTTP/S requests and delivers logs of unmitigated traffic to an S3-compatible bucket owned by the customer. RADAR reads the filtered log stream through a dedicated virtual network interface on the Detector, using read-only credentials.
Configure the Akamai Interface:
- On the Network Interfaces page, click the name of the network interface to configure.
- Under the Traffic Source dropdown, select Logs.
- Under the Application dropdown, select Akamai.
- In the S3 Bucket Name field, enter the S3 bucket name as shown in the S3 platform.
- In the S3 Access Key ID field, enter the access key ID generated in the S3 platform.
- In the S3 Secret Access Key, enter the secret access key generated in the S3 platform.
- Configure the Log Latency (Seconds) based on the environment.
- Select the appropriate Security Layer for the interface.
- Select the Mitigation Vendor.
- Click Save to apply the changes.
What's Next
Now that you've connected the relevant network interfaces to the appropriate security layers, proceed to How to Create a Mitigation Profile to configure a Profile for your next simulation.