
What is a DDoS Simulation Result in RADAR?
A DDoS Simulation Result in RADAR is the outcome of a simulated DDoS attack for a specific combination of Target, Attack Vector, and Security Layer. The result reflects how traffic was handled by your mitigation infrastructure, based on real-time validation metrics captured during the simulation. Each result is classified as Protected, Partially Protected, Vulnerable, or Unchecked depending on how effectively the selected security layer mitigated the simulated attack.
What You'll Learn on This Page
On this page, you’ll learn how to access, read, and interpret your DDoS simulation results in the RADAR platform. You’ll understand how to evaluate protection status, analyze simulation data, and identify areas where mitigation may need to be improved.
Managing and Reviewing Simulation Results
Follow these steps to manage and review your DDoS simulation results in the RADAR platform:
- In the left-hand navigation menu, click Simulations.
- Select Simulation Results.
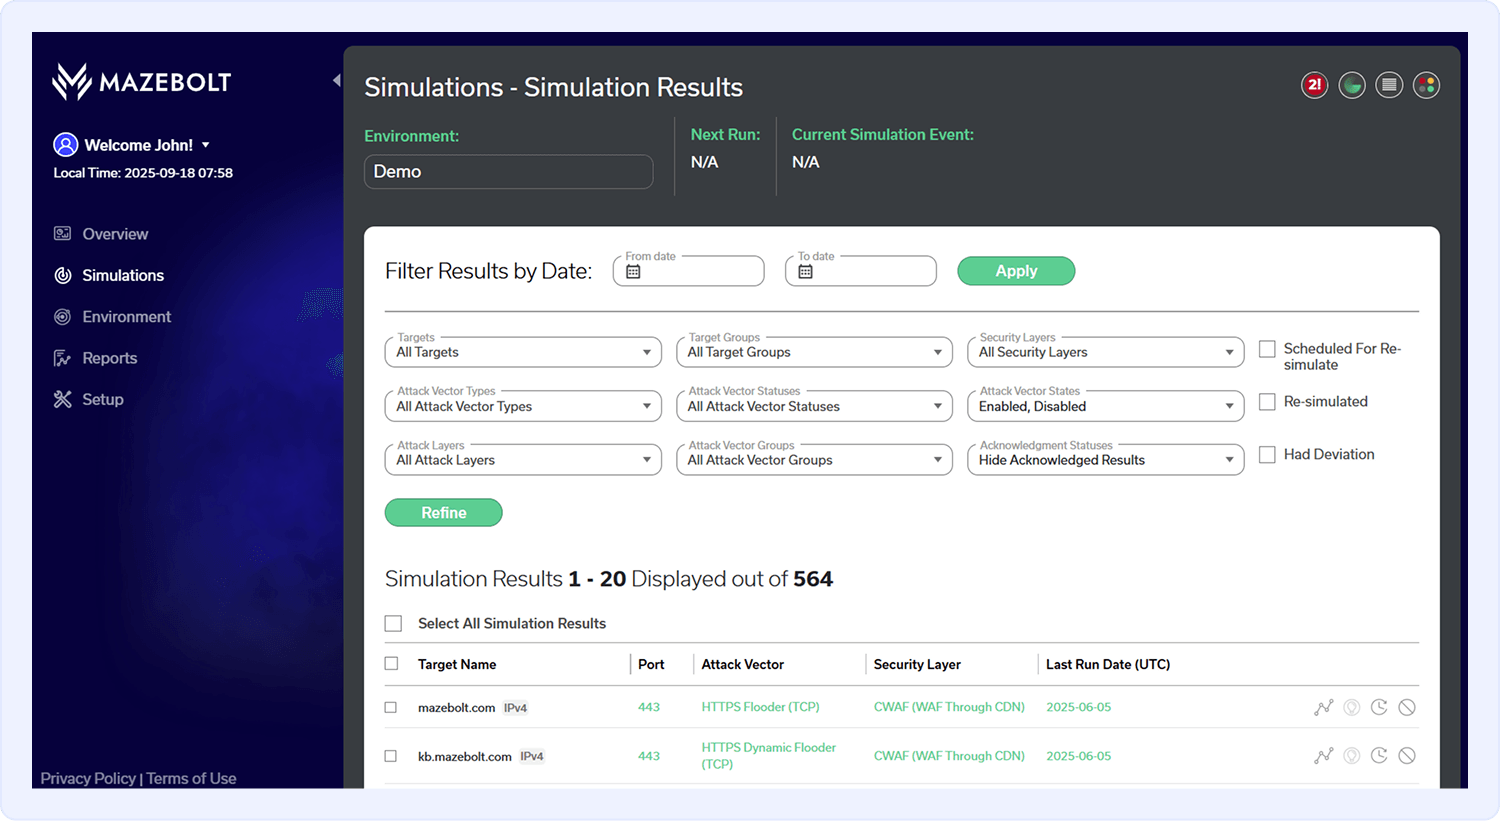
Filter by Date Range
At the top of the page, under the “Attack Vectors & Results for” bar, you can filter the results by selecting a start (“From”) and end (“To”) date to define the desired date range.
If no filters are selected, the table will display the latest simulation results.
Apply Filters
Below the date range, you’ll find additional dropdown menus that allow you to narrow results by specific Targets, Attack Vectors, or Security Layers tested within the simulation cycle. Once you’ve selected the relevant filters, click the Refine button to apply them.
View Simulation Results
In the table below the filters, you’ll see all simulation results. Each entry represents the outcome for a specific combination of Target x Attack Vector x Security Layer tested during the simulation cycle.
Note
• Click the Target Name to view its configuration details and adjust settings
• Click the Attack Vector to open its detailed entry in the MazeBolt Knowledge Base, which provides an in-depth technical breakdown of the vector’s behavior, traffic patterns, and potential impact on network components
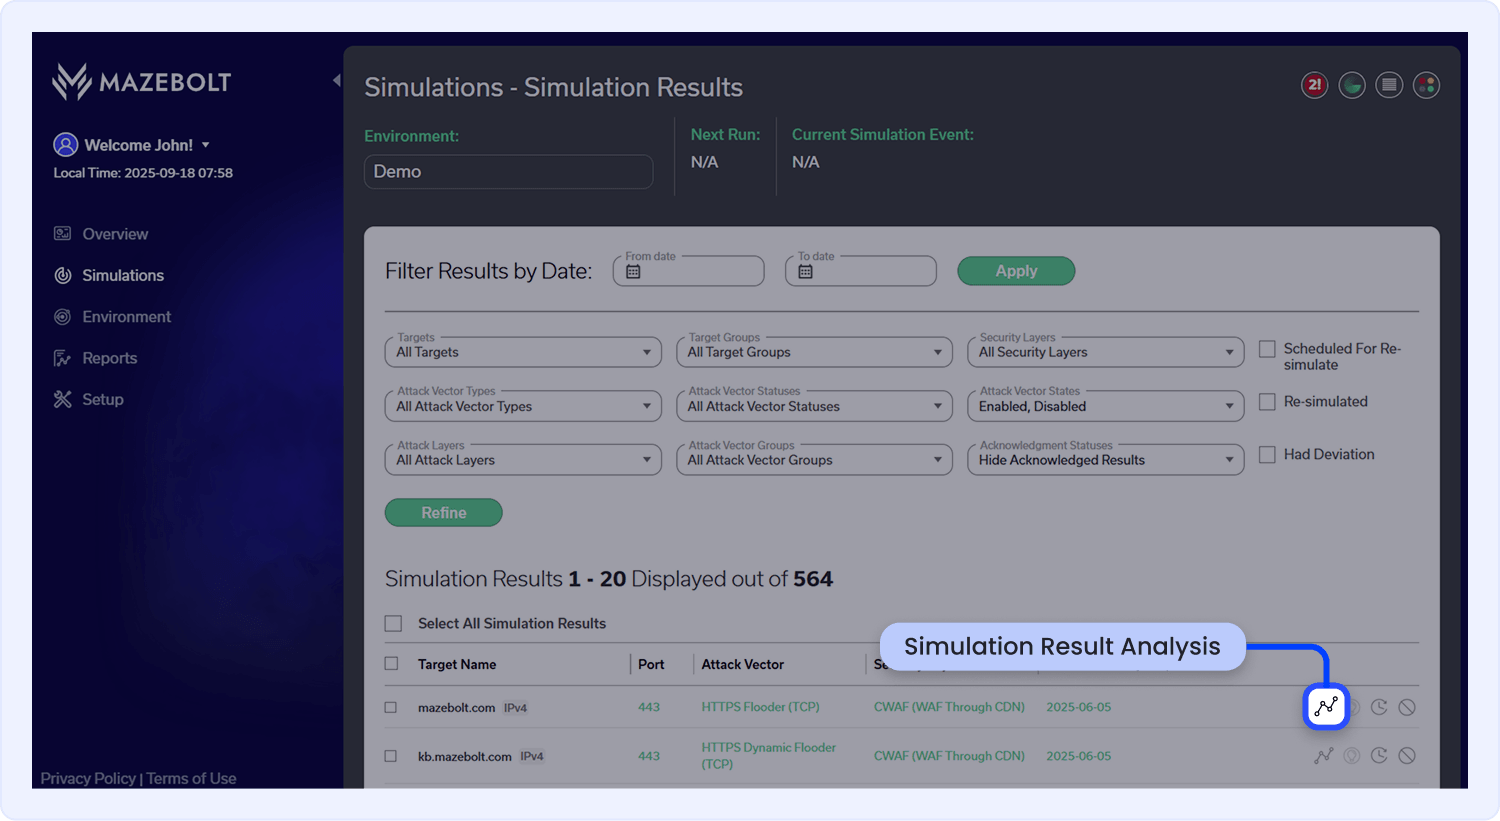
On the right side of each row, you’ll find four action buttons.
Below is an explanation of how each button is used:
Simulation Result Analysis:
Click this button to view a detailed breakdown of the simulation result for the selected Target × Attack Vector × Security Layer combination.
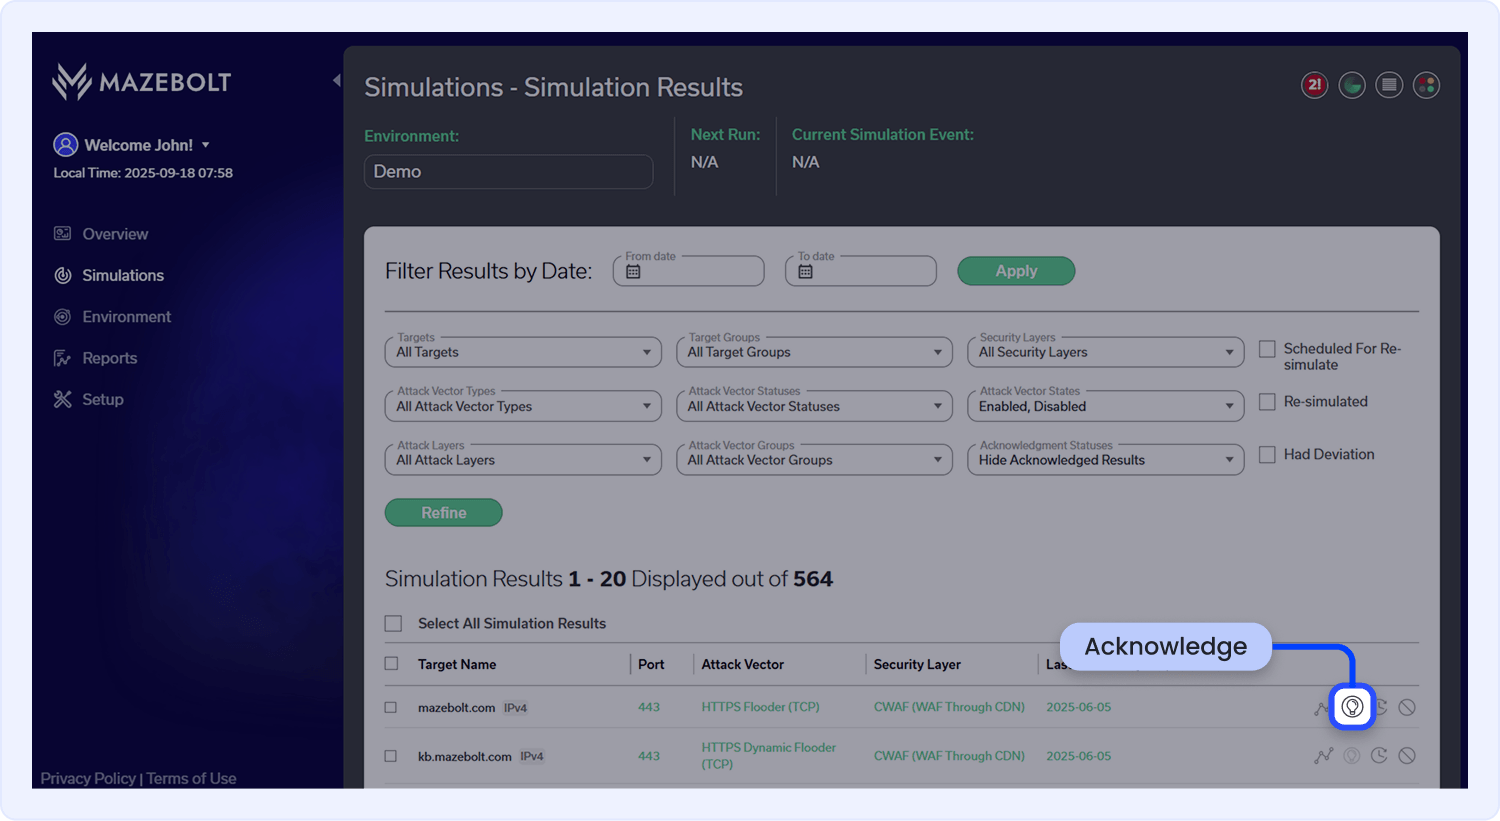
Acknowledge:
This action is available for all protection statuses except Protected. Use the Acknowledge button to mark a simulation result as reviewed and intentionally accepted. Use this action when a Vulnerable outcome is expected and cannot be addressed at the current security layer. Once clicked, a confirmation window prompts you to select a reason for the acknowledgment; after choosing, click Confirm. Acknowledged results are removed from the dashboard and will not reappear.
Note
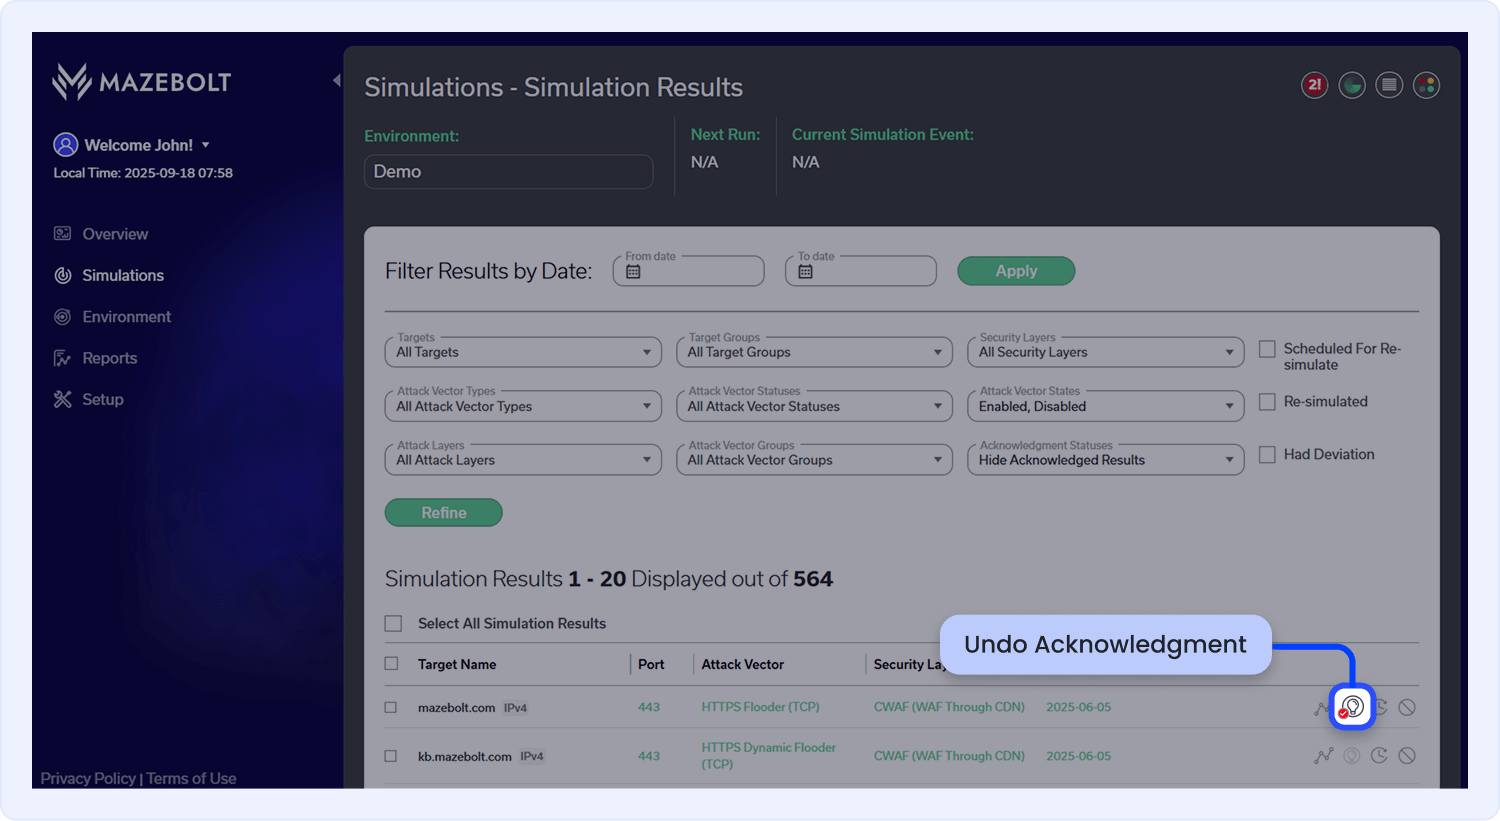
If you need to reverse the Acknowledgment action for a result, follow these steps:
1. At the top of the page, go to the filter dropdown menus.
2. Under Acknowledgment Statuses, select Show Acknowledged Results Only, then click Refine to apply the filter.
3. In the filtered table, you’ll see that the Acknowledged button is checked on the right side of the result row, indicating it has been acknowledged.
4. Click the Acknowledged button to reverse the acknowledgment.
Resimulate in the Next Standard Assessment Cycle:
This action will automatically queue the selected Target x Attack Vector x Security Layer for inclusion in the next scheduled Standard Assessment simulation cycle and remediation session.
Queued results will only run in simulation cycles that include the tested security layer and only if that layer is selected when scheduling the event via the Add Event action.
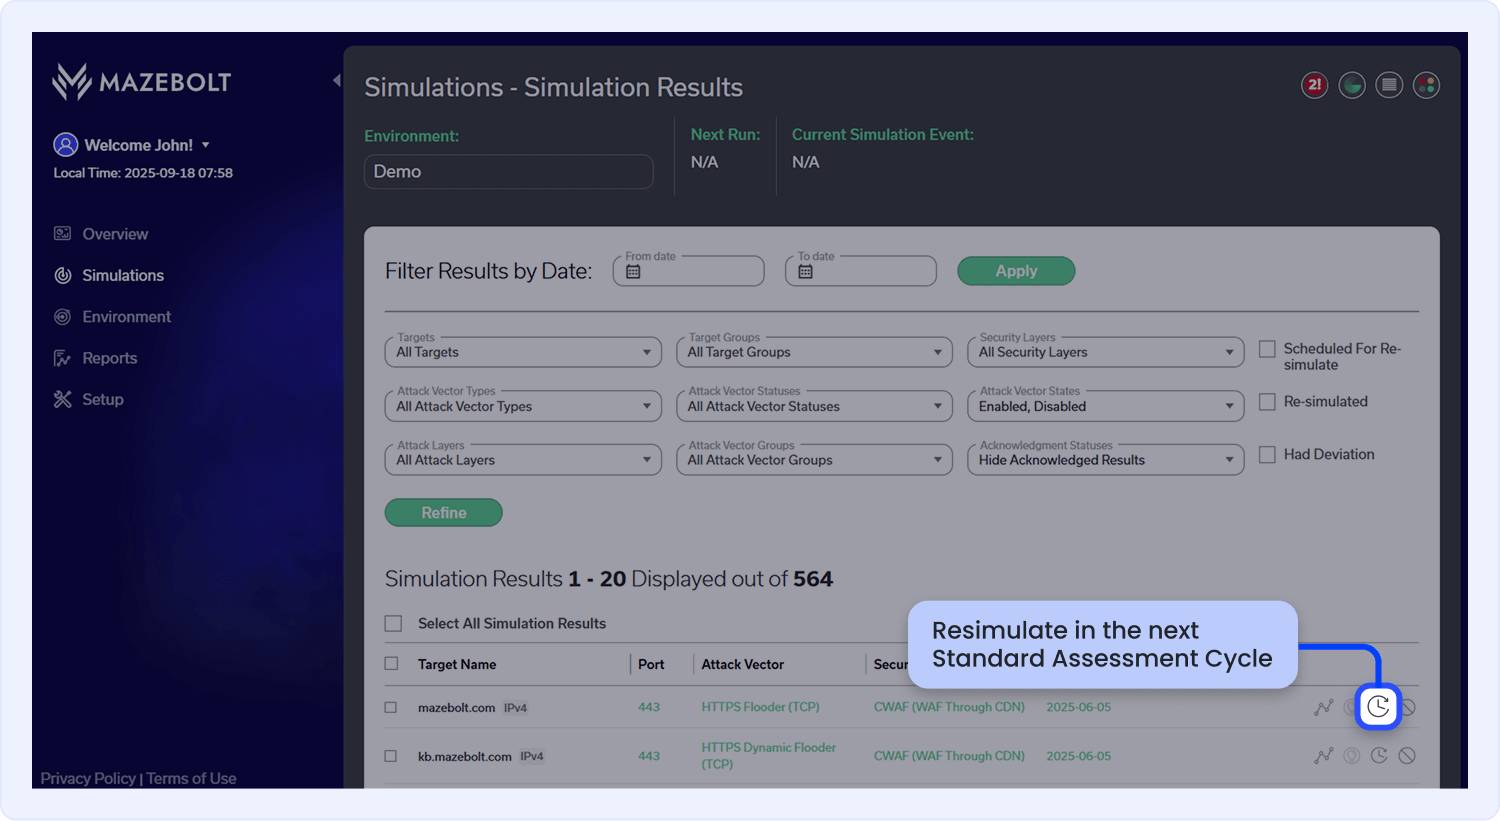
- Order of Selection - on the Simulation Results page, when selecting multiple entries for re-simulation, the last entry selected is prioritized and executed first.
- Bulk Action - on the Simulation Results page, you can select or deselect multiple target-vector combinations simultaneously. Once you begin selecting items, a bulk action menu will appear at the bottom of the screen, allowing you to apply actions to all selected entries at once.
Disable Target Validator:
Use this button to disable a specific Target × Attack Vector combination from the platform. Once disabled, this combination will still be included on the dashboards, reports, and simulation results, and it will no longer be available for future simulations or analysis.
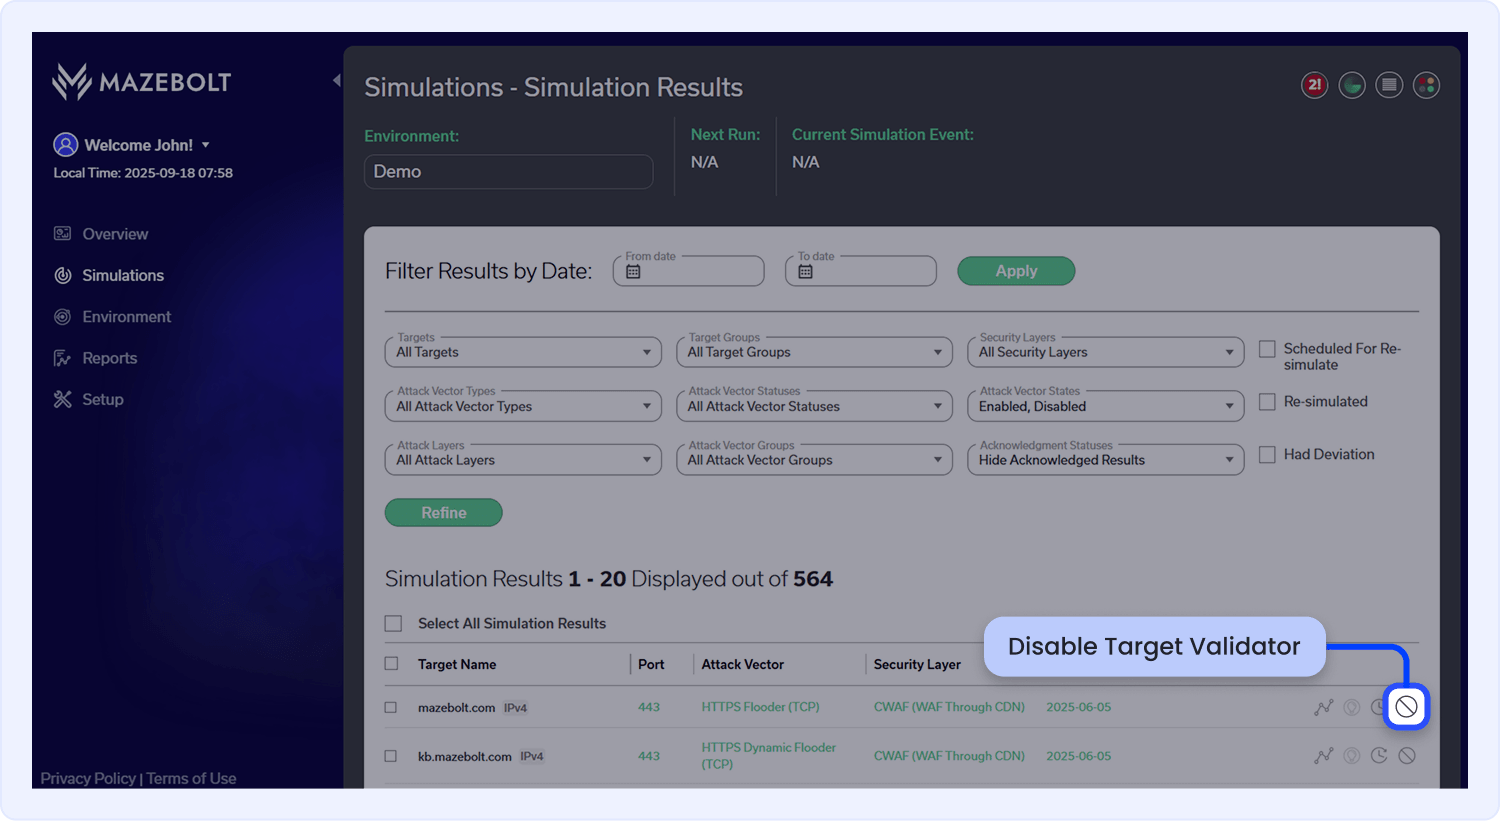
Note
If you need to reverse the Disable Target Validator action for a result, follow these steps:
- At the top of the page, go to the filter dropdown menus.
- Under Attack Vector States, select Disable, then click Refine to apply the filter.
- In the filtered table, you’ll find a button on the right side of each Target row that allows you to Enable the Target Validator.
- Click the button to open a window displaying the details of the unvalidated Target. Review the information, then click Save to Enable it.
Reviewing Live Simulation Results
Clicking the “Simulation Results Analysis” button opens a detailed view of the simulation data and outcomes.
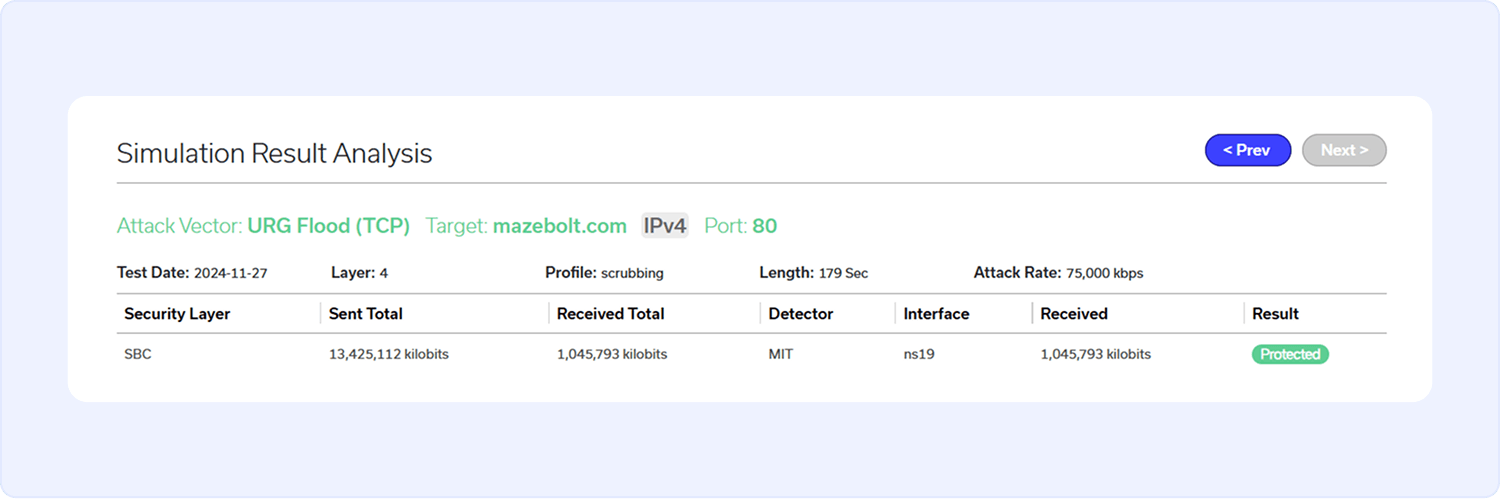
This page provides a breakdown of the simulation’s performance metrics for the selected Attack Vector x Target x Security Layer, organized by security layer and network interface.
At the top of the page, you’ll find a summary of key parameters, including:
- Attack Vector
- Target
- Port
Simulation Results Breakdown
Just below the summary, you will find key simulation details including the Test Date, selected Layer, associated Profile, Length, and Attack Rate indicators. These values provide essential context including an indication of whether the simulation was completed or cut off prematurely, and showing the rate at which attack traffic was generated.
Below that, you will find a security layer breakdown table outlines the performance data for each simulation run. Each row corresponds to a specific combination of security layer and network interface, offering a detailed view of how that segment of your infrastructure handled the attack.
Each column in the table provides the following insights:
- Security Layer - The security layer assigned to the simulation
- Sent Total - The total amount of malicious DDoS traffic sent through the entire simulation
- Received Total - Sum of malicious DDoS traffic detected at each network interfaces for the entire simulation
- Detector - The name of the detector assigned in the simulation
- Interface - The network interface assigned in the simulation
- Received - The amount of malicious DDoS traffic detected at the specific network interface
- Result - The final protection status (e.g., Protected, Partially Protected, Vulnerable and Unchecked)
Simulation Results Breakdown
Below the Simulation Results Table, you’ll find the Show Attack Vector Test History section. Click the arrow next to the header to expand a detailed table displaying historical test data for the selected simulation.
This table includes key technical metrics for each instance where an Target × Attack Vector x Security Layer combination was tested:
- Simulation Start and End Time - The duration of the simulation cycle
- Tested Target and Port - The specific Target and destination port used
- Target Validator - The name of the attack vector tested
- Attack Rate Parameters - The rate of simulated traffic, measured in CPS, KBPS, or PPS, depending on the attack type
- Security Layer - The mitigation layer that handled the simulated traffic
- Sent / Received Traffic - Total traffic sent and the amount received at the mirror port
- Result - Final outcome (Protected, Partially Protected or Vulnerable)
- Retest Status - Indicates whether the simulation was re-executed using the Re-simulate action
Attack Rate Graph
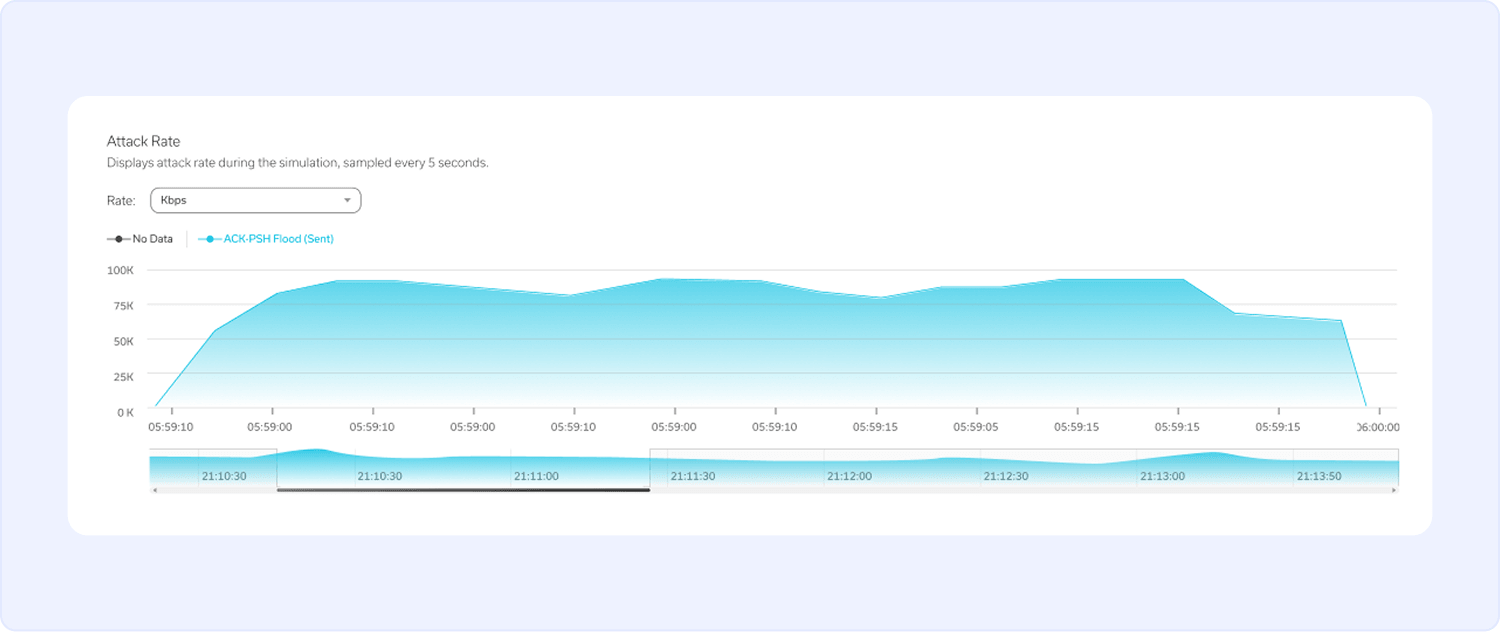
The Attack Rate graph provides a visual timeline of the simulation’s attack rate. It helps you track how the attack evolved by displaying traffic volume based on your chosen metric.
You can switch between the following units using the dropdown menu:
- Kbps – Kilobits per second
- PPS – Packets per second
- CPS – Connections per second
This visualization helps you analyze how the traffic load was applied and sustained during the test.
Response-Time Monitoring Graph
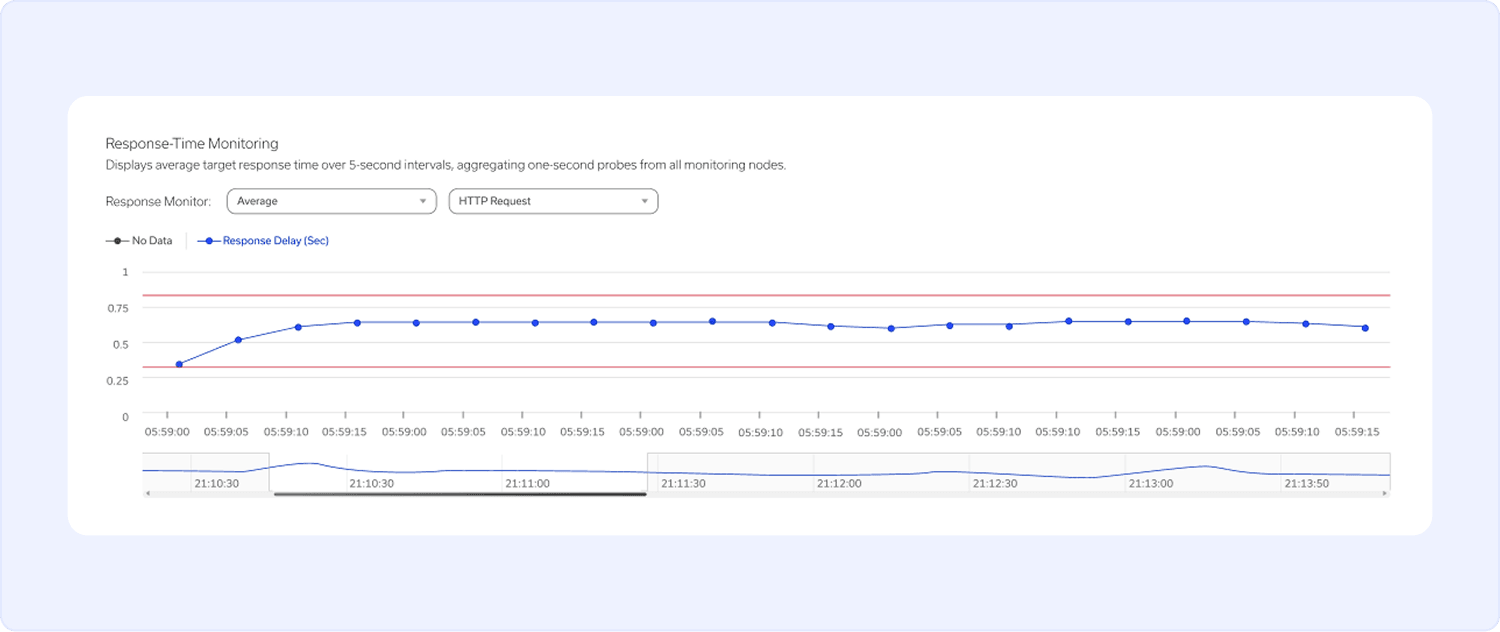
The Target Response Monitoring graph tracks how the Target responded throughout the simulation, offering insight into system behavior under load.
- Response Monitor Dropdown Selector – Allows you to view response times from different monitoring regions or as a global average. Selecting a specific region shows that region’s performance.
- Graph Lines:
Blue Line - Actual response times captured in real-time.
Red Line - The predefined threshold for acceptable response time.
Any deviation beyond the threshold is visually highlighted, helping you quickly identify abnormal behavior that could indicate degraded performance or instability.
Note
The Target response monitoring chart reflects the combined response time data from all the monitoring nodes involved in the simulation.