
What is a DDoS Simulation in RADAR?
A DDoS simulation in the RADAR platform is a controlled, nondisruptive test conducted as part of a simulation cycle. It replicates a real DDoS attack by sending simulated malicious traffic to a defined Target in your environment, with traffic rates carefully managed to ensure no impact on live services.
These simulations evaluate how your mitigation systems interact with malicious DDoS traffic, helping to identify vulnerabilities, misconfigurations, and gaps in protection. RADAR evaluates the real-time behavior of your security layers, enabling continuous validation and enhancement of your organization’s DDoS resilience.
What You'll Learn on This Page
On this page, you’ll learn how to view a live running simulation, monitor the behavior of the selected target, and review key simulation parameters such as traffic rate and target response time.
Viewing Live DDoS Simulation Details
Follow these steps to view your Live Simulation details in the RADAR platform:
- In the left-hand navigation menu, click Simulations.
- Select Scheduler.
- On the calendar, ensure that today’s date is selected.
- Locate the scheduled simulation in the list and click the Details button.
What You'll Find on the Simulation Details Page
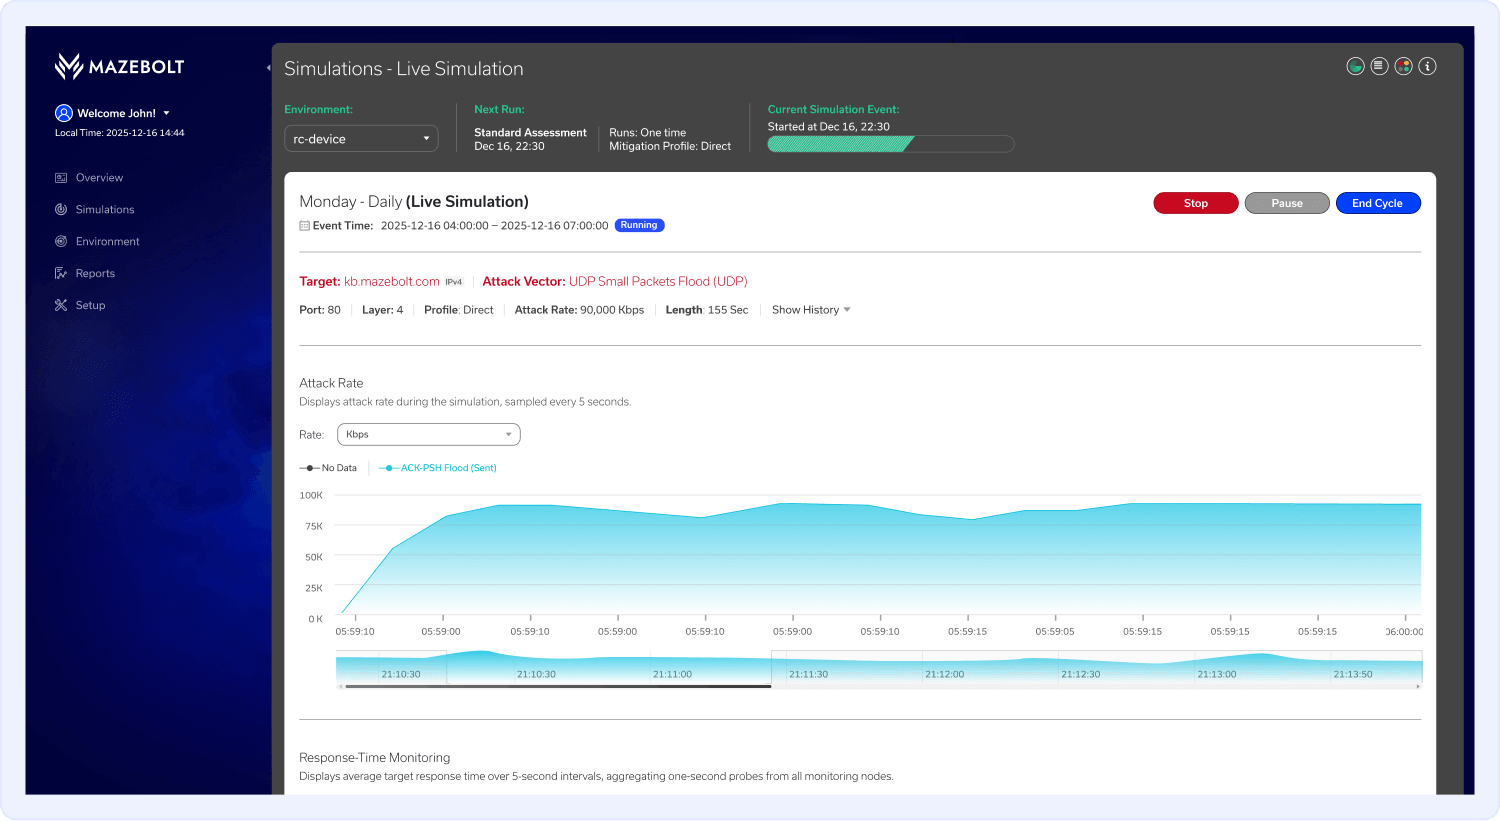
After clicking the Details button, you’ll be directed to a page displaying real-time information about the simulated attack and its associated Target. This page provides key insights to help you monitor and analyze the simulation. The page includes the following details:
Key Actions
- Stop button - Ends the current simulation and immediately proceeds to the next one in the cycle.
- Pause button - Pauses the cycle until it is manually resumed.
- End Cycle button - Terminates the entire cycle, but allows the currently running simulation to complete.
Target
The selected Target for this simulation cycle
IP Version
The selected IP version for this simulation cycle.
Attack Vector
The selected attack vector for this simulation cycle.
Attack Rate Graph
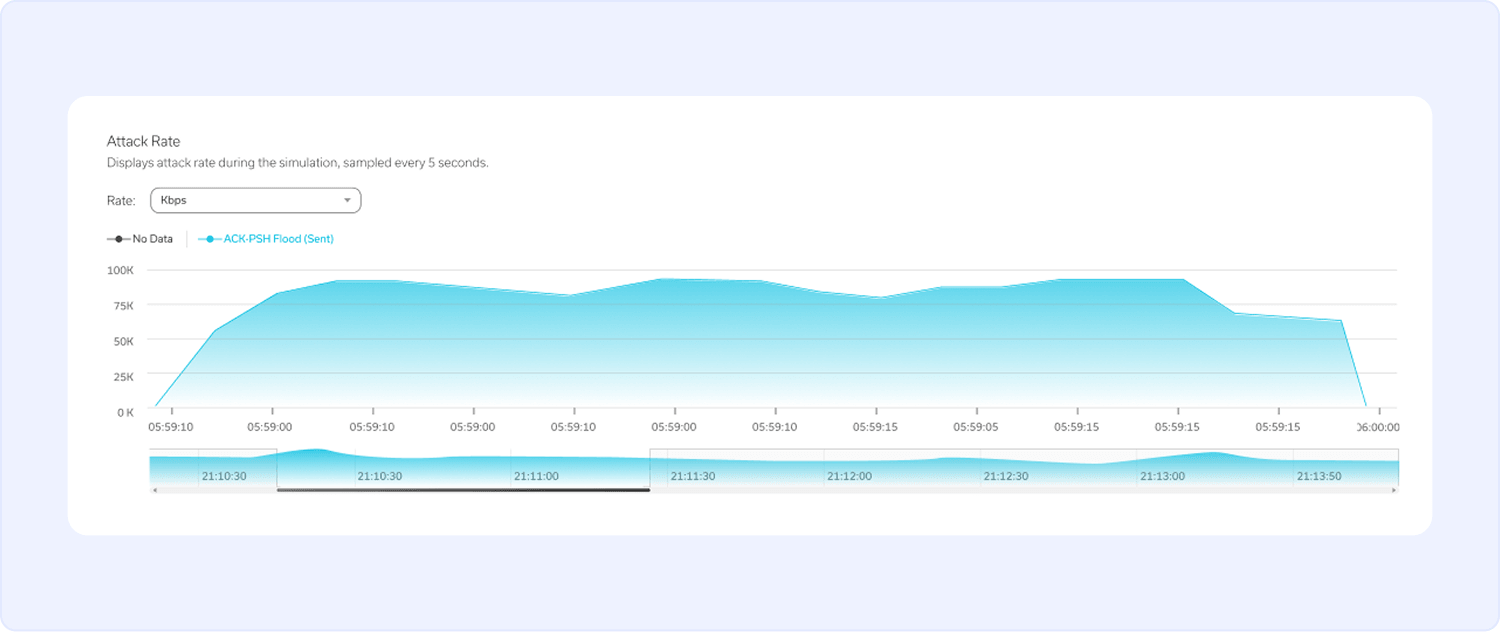
This graph provides a clear view of how the attack progressed during the simulation, displaying traffic volume over time based on the selected rate metric (CPS, PPS, or Kbps).
You can switch between the following units using the Rate dropdown menu:
Kbps – Kilobits per second
PPS – Packets per second
CPS – Connections per second
This visualization helps you analyze how the traffic load was applied and sustained during the test.
Response-Time Monitoring Graph
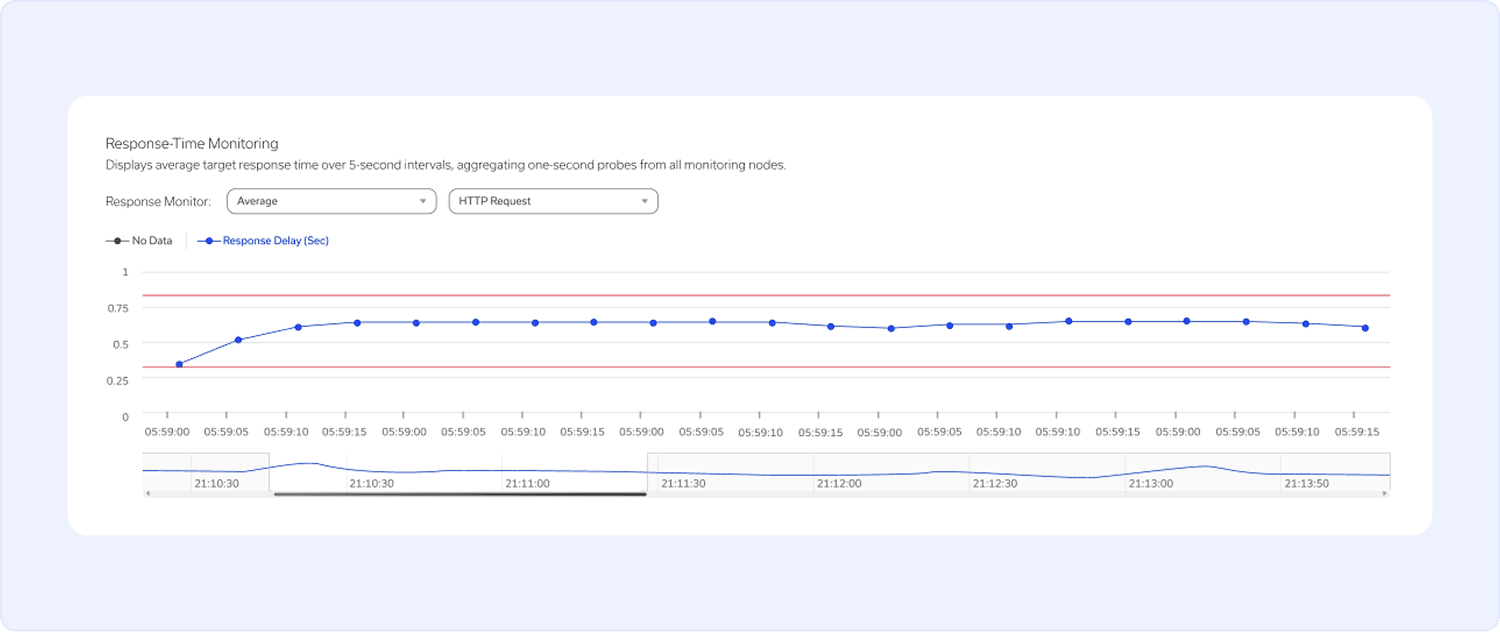
This graph tracks how the Target responded throughout the simulation, offering insight into system behavior under load.
Response Monitor Dropdown Selector – Allows you to view response times from individual monitoring regions or as a global average. Selecting a specific region shows that region’s performance, making it easier to detect localized issues.
Graph Lines:
• Blue Line - Actual response times captured in real-time.
• Red Lines - The predefined threshold for acceptable response time.
RADAR’s monitoring mechanism ensures that simulations run nondisruptively, preserving Target availability so tests can be performed safely in live production environments.
When the response time deviates from the expected baseline, the platform automatically triggers a simulation cut-off.
Note
How RADAR Classifies Simulation Results:
• If 30% or more of the simulated malicious DDoS traffic is observed on the downstream mirror port before a cut-off, the simulation result is marked as Vulnerable.
• If traffic visibility is inconclusive or the observed data is insufficient, the result is marked as Partially Protected.
• If less than 30% of the simulated malicious DDoS traffic is detected, the result is classified as Protected.
Simulations Executed in the Same Cycle
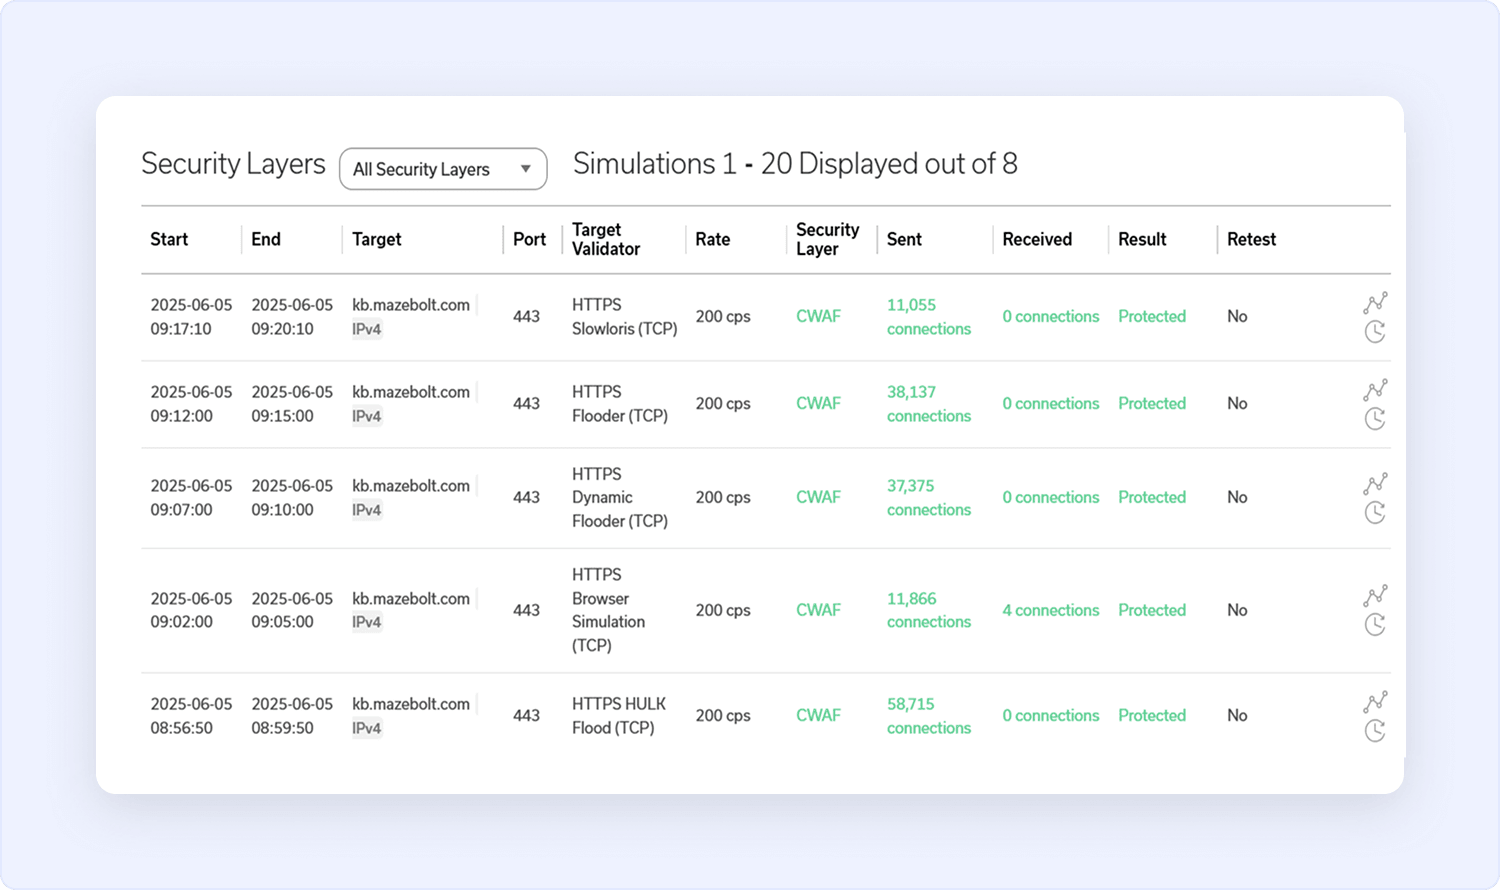
This table lists all simulations that were executed as part of the same simulation cycle.
For each combination of simulation (Target x Attack Vector x Security Layer), you’ll see the following details:
- Sent - The total number of connections, kilobits, or packets sent toward the Target.
- Received - The number of those connections, kilobits, or packets that were successfully observed on the Mirror Port downstream from the relevant Security Layer.
- Security Layer - The mitigation layer through which the traffic passes.
- Result - The final simulation outcome (e.g., Protected, Vulnerable).
- Retest - Indicates whether the simulation was re-executed using the Re-simulate action.
This view helps you see all the results across multiple simulations in a single cycle and identify potential issues across different Targets or mitigation layers.
How RADAR Ensures Safe, Nondisruptive Simulations
To ensure simulations are nondisruptive and reliable, RADAR performs the following safety checks before starting a simulation:
1. Monitor Stability Check
RADAR initiates stability checks by sending legitimate traffic to the Target. This check ensures the Target is stable before the simulation begins.
2. Diagnostic Test Validation
RADAR initiates a diagnostic test by sending legitimate traffic to the Target. This confirms that the detector is properly receiving traffic.
Note
If any of the above checks fail, the simulation will not be initiated. It will be marked as Unchecked, and RADAR will automatically proceed to the next scheduled simulation in the queue.